Pricing Models – 4 Changes Banks Need to Make Now

Our recent sampling of 73 banks indicates that most banks have not adjusted loan or relationship pricing assumptions over the last two years. That could be a mistake as the environment has been radically different since 2020, and many banks are mispricing their commercial loans and relationships. In this article, we provide banks with four changes, that account for about 90% of performance, that should be made in loan pricing models, plus deliver the data around those changes.
Loan Pricing Model Basics
If your bank doesn’t have a relationship pricing model or at least a loan pricing model that handles cost and risk – you should. It is the single biggest thing you can do to improve profitability.
Making loans is central to your bank’s operations, and lending has a compounding effect on profitability. Not only do you have to live with each pricing decision for an average of four years, but you often leverage that decision eight to twelve times. Inaccurate pricing is suboptimal in the best of times and catastrophic under the worst.
Not having a loan pricing model is like trying to drive across the country without a map or GPS – you might get where you are going, but you might not. If you do make it, the odds are that your route was highly inefficient. Worst of all, you likely didn’t record your way, so you can’t improve upon your trip next time, and you didn’t institutionalize your knowledge so other drivers (lenders) can improve their performance.
There are several good relationship profitability models available, including ours, called Loan Command, where you can be live in two days for as little as $80 per month with no upfront costs. We use the model for our bank and make it available at our incremental cost to other financial institutions. We keep the price low and the contract flexible, so there is no excuse for a bank NOT to have this valuable tool.
Hopefully, you have a pricing model. Assuming you do, let’s talk about some of the changes you should have made or should make.
Change 1: Cost of Capital and Capital Allocation
Back in 2020, banks’ capital cost was at a record low as it averaged a little under 6% for the industry. Now, the cost of capital has been up 44% since then. The higher cost of capital is driven by higher interest rates, higher equity returns expectations, and greater volatility.
For the average community bank, the cost of capital is currently hovering around 11.83%, which means banks need to produce above that amount in risk-adjusted return on capital (RAROC) to stay in business. Produce over that amount, and you will both generate capital to fund future growth, and your return will be such that you will be able to attract future capital.
Produce under that amount, and you will eventually go out of business. Grow and produce under that amount, and you will go out of business faster. No one wants that. While a customer may like the fact that you underpriced their loan, if they thought about it, they want to make sure you remain in business and provide your capital and services to the community.
Capital is the most significant single input into a relationship pricing model by sensitivity, and its cost should be increased and kept current. Below is our current weighted cost of capital for different-sized banks.
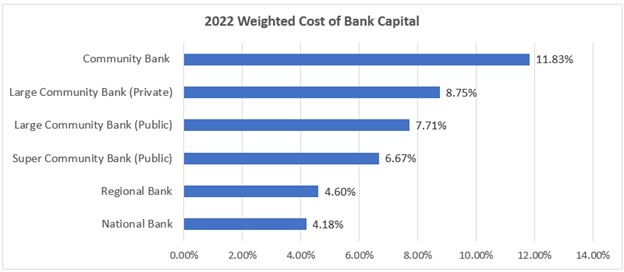
Many models don’t allow the user to increase the cost of capital, so users need to adjust the allocated capital. In addition, banks have increased the allocated capital to offset the higher systemic credit risk and credit volatility associated with higher rates.
On average, banks have increased their allocated capital from 10% to 11%.
Change 2: ROE / ROA / Customer Lifetime Value Target Adjustments
Of course, as rates go up, mathematically, your numerator gets larger (net profit) while your denominator stays the same (allocated capital) in the profitability calculation. What was a 9% to 12% RAROC target for most banks during the past two years is now in the target range of 12% to 15%.
A 15% RAROC target equates to about a 1.7% return on asset target for banks that measure performance using that metric.
These targets help inform lenders on how to structure the loan accordingly. When structuring for profitability, both the bank and the customer, pricing is one of the many elements and often of secondary importance. Deposits, other product income, loan maturity, rate structure, and credit all can have an equal or greater impact on relationship profitability than pricing. This is yet another reason why a loan pricing model is so valuable – it helps lenders be conversant in structuring a loan so they can arrive at the best structure for the customer and bank.
Change 3: Inflation and Expenses
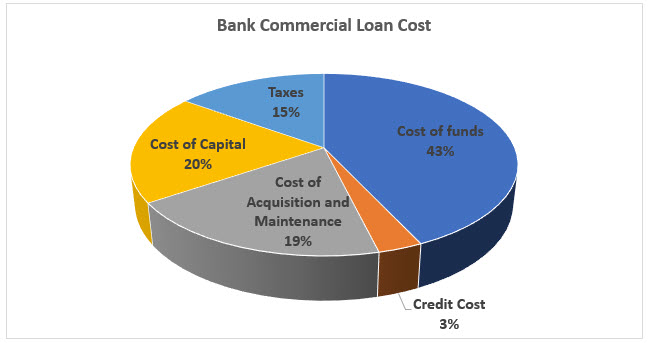
The third major change that banks should consider in their loan pricing models is their customer acquisition, origination, and maintenance costs. The cost of acquisition and maintenance is material and makes up about 19% of the expense base of the average loan, almost equal to capital (below).
If your bank’s model has expenses calibrated as a percent of the loan amount, then there is only likely a slight adjustment needed. However, if you have a model where some costs are in dollars, and you have not updated them in the last year, then this is likely another adjustment that should be made.
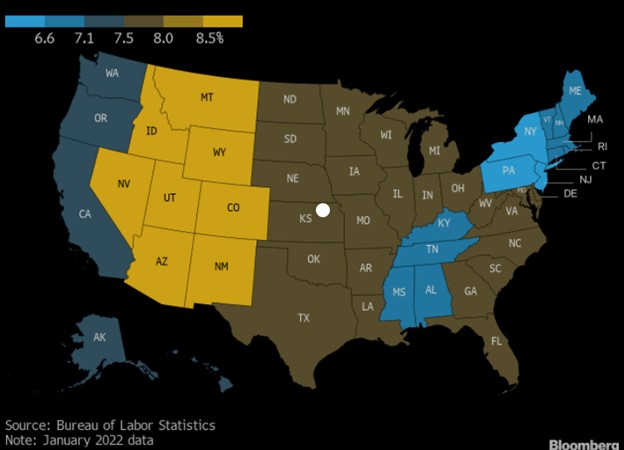
Producer prices (PPI), an index some banks use to mirror the general cost in the marketplace, is up 10% on an annualized basis compared to last year. Since PPI includes commodities, other banks look at wage inflation (since that composes about 82% of a bank’s cost) and use Federal Reserve Atlanta to track it. Here, wage growth has been running at about 5.8%. Other banks use the financial sector total compensation or wage/salary data from the Bureau of Labor Statistics, which has been running around 6.3%. Finally, others use this data from their state or region and get the statistics below.
On average, most banks are now adjusting their costs by around 11% since the last time they updated their model two years ago. Whatever adjustment is made, it should consider inflation around total labor compensation, real estate, office equipment/supplies, software, travel, marketing, and management expenses.
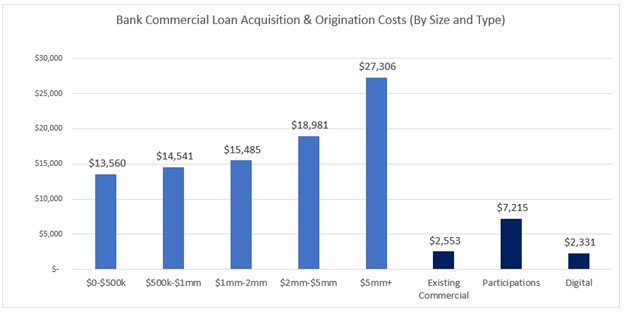
By way of example, below are sample costs for bank commercial customer acquisition and origination costs for 2022. These fully allocated costs include the sales process, underwriting, origination, and booking. These costs are broken down by loan size and type to include renewals, participation, and loans coming 100% through digital channels (such as online or partnerships).
Change 4: Spread Guidance and Index Adjustments
With the above changes made along with the regular quarterly changes to the cost of funds, deposit beta, and credit risk, banks can now use their model to provide “spread guidance” to their salesforce. This best practice means that while bankers target a risk-adjusted return on capital for a relationship over the customer’s projected lifetime with the bank, they should try to achieve certain loan spreads to balance value across the organization.
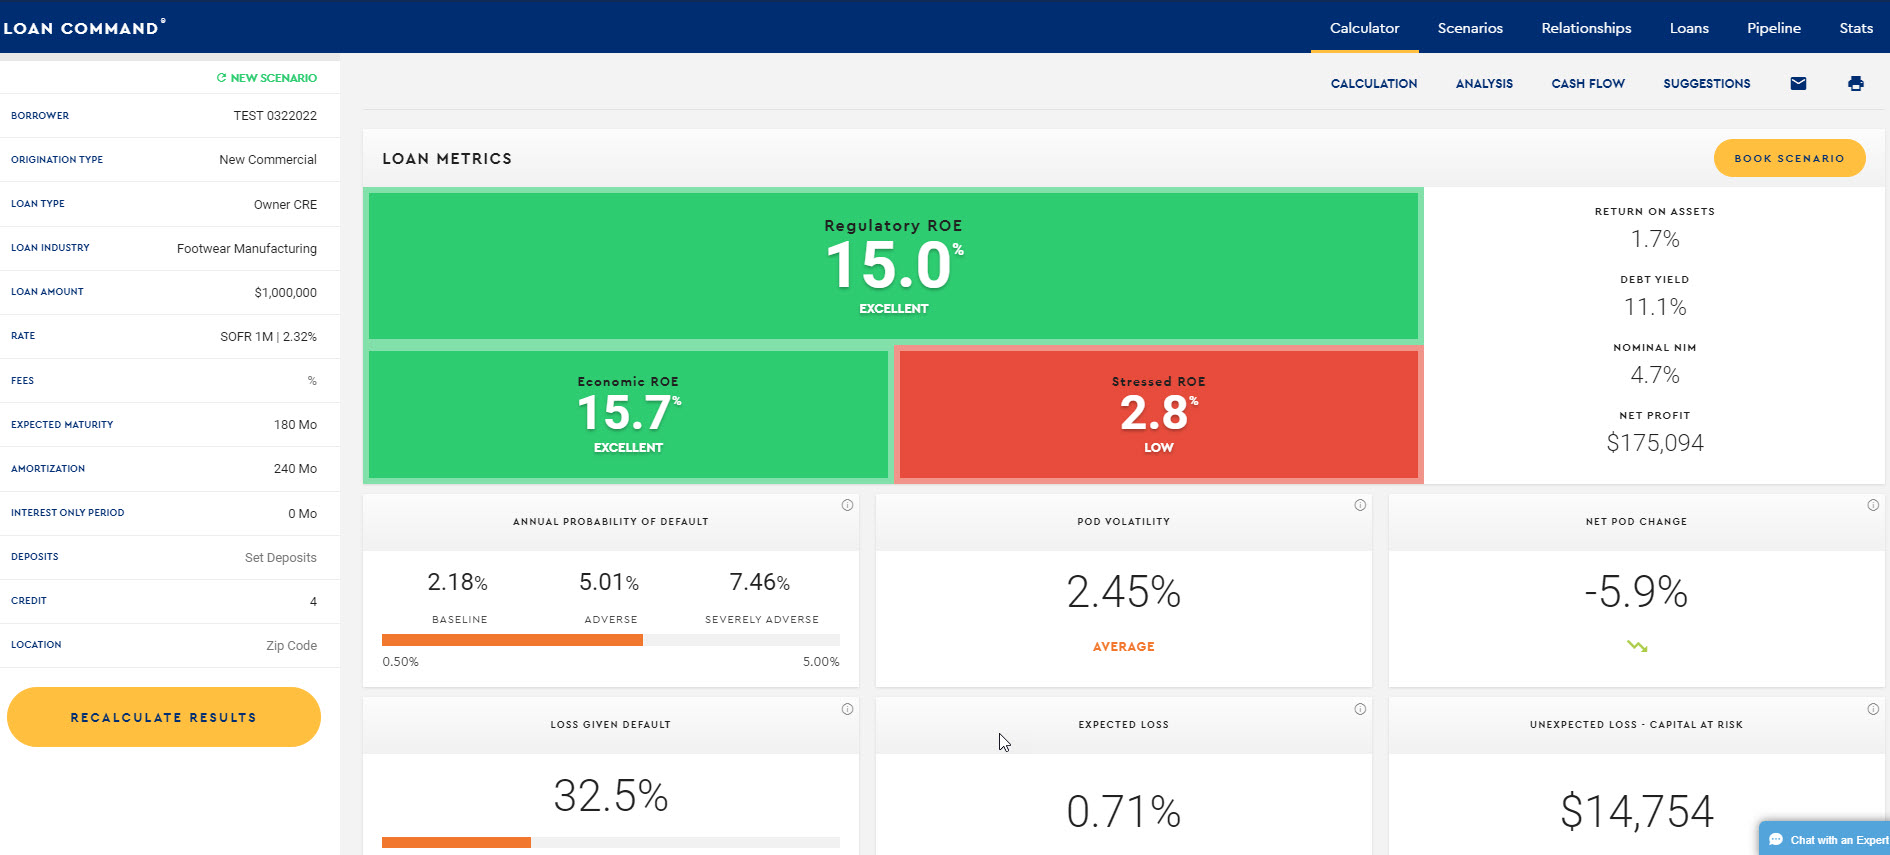
To calibrate your model correctly, banks can use a reference transaction similar to the one below that can serve as a benchmark or “calibration transaction.” We use a $1mm 20-year amortizing loan due in 10 years with no fees or deposits as a base case. For a typical market return of 15% RAROC, this equates to a SOFR + 2.32% spread, or the equivalent of what was LIBOR + 2.22%.
On this point, banks should square away and train on how they want their lenders to adjust for some of the new indices that replaced Libor. For our favorite, SOFR, we like a standard and simple, ten basis point adjustment in pricing. For banks using BSBY, or Ameribor, they will need to adjust accordingly and issue new spread guidance.
Some banks have opted to create their index with an adjustment contained within. This helps to maintain the post-Libor spreads, but it also comes with higher costs and complexity. Banks will need to change their core system, train, and then educate borrowers (and lawyers) on the composition and methodology of the index.
Far better, in our opinion, is to either build the additional adjustment into your loan pricing model or add the required spread to your spread guidance. This pathway is cheaper, more straightforward, and easier to manage in the long run, with the only downside of spread changes being hard to track.
Once you have the Libor-to-new-index spread adjustment worked out, then you should publish and train on spread guidance in order to help lenders and relationship managers get in the right minimum ballpark with their clients.
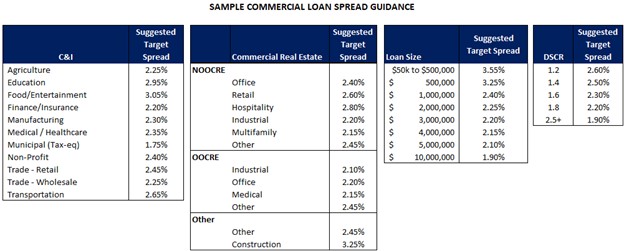
Sample spread guidance can be along several dimensions and can include loan type, loan subtype, loan size, risk, and geography. Below is a sample matrix that some banks use to target spreads along some of those dimensions.
A Word on Credit
Noticeably missing from this list are credit adjustments. While most banks have consistently updated their credit adjustments, some banks have chosen not to make the adjustments by design. For 2020, for example, the average reserve for commercial real estate was 1.68%. For this quarter, it is approximately 1.34%. Given the higher probability of a recession, increased volatility and known problems in office/retail, many banks have chosen to keep their model reserves where they are.
Putting This into Action
Since every bank is different, every bank will have to arrive at its own inputs and guidance. Use the above information to inform your pricing model. Depending on your location, the types of clients you have, your bank’s cost structure, and the types of loans you originate, you will have your own set of inputs. The critical takeaway here is that you have updated your model and have trained on the new inputs and guidance.
Pricing relationships correctly is an essential function that banks can do to drive profitability and to ensure they are producing above their cost of capital. Pricing is a dynamic endeavor, and all banks should have a process, a methodology, and a cadence for how often their model gets updated.
Price correctly, and you can use that excess capital you generate to make your customers, employees, and shareholders happy. Price incorrectly, and over time, no one will be happy.