What Machine Learning Taught Us About Branch Management

These days, if you want to make tough branch decisions, use a good college student instead of an experienced banker. We will come back to the college student but, in this post, we pitted experienced bankers against the latest branch models against the latest machine learning applications to see which method was more accurate at predicting branch performance. The answers will not only surprise you, but what we learned along the way will help improve your thinking about branching, machine learning, and the new paradigm of quantitative banking.
The Branch Challenge
If you want to build a new branch, want to acquire a branch, or want to discontinue a branch, there is a decision framework to guide your decision. Often, when managing a branch or a network of branches the question is not which branches are popular, but what branches are underperforming given their potential? Answers to that question not only drive what to do with your branches but also where to invest further resources. If you are looking for a new branch location, then it is the complementary question of which area would perform the best. Knowing these answers can not only give you a logical framework to make a decision but if the predictions are accurate, can save you a significant amount of time, resources, and risk.
Below are select branches and production heat map.
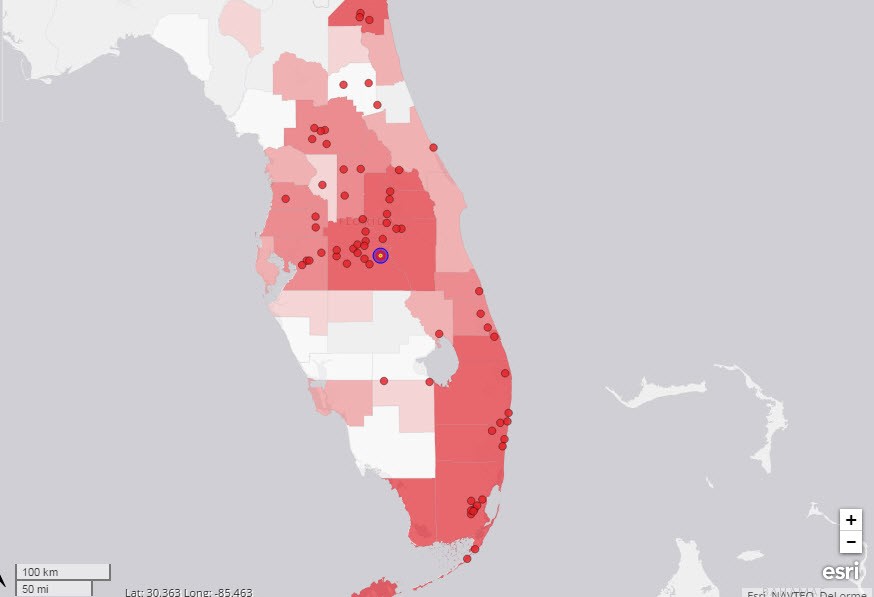
For clarity, to answer these questions you want to specifically know: What is the expected profitability of any potential branch or existing branch. You also want to know if you have a prediction, how accurate that prediction is so you know if you can rely on it or not.
The Branch Prediction Competition: Man vs. Model vs. Machine
So we devise a competition. We take a group of experienced bankers, show them non-performance branch information such as location, competition, traffic patterns/counts, parking, demographic data, economic statistics, etc., and then have them predict if the branch is profitable or not looking at a ten-year time horizon. We take their prediction and compare it to actual numbers. We then can gauge the accuracy of how good their mental model is.
Next, we take some of the more popular branch models that are available to purchase or to hire a consulting service and we feed their non-performance branch data into the model and ask them to predict. We compare the results.
Finally, we feed all the non-performance branch information we have into an application that takes the data, learns from it, builds a model, tests the model and relearns from the model. We then compare the results to determine accuracy.
The Problem with Bankers Predicting Branch Performance
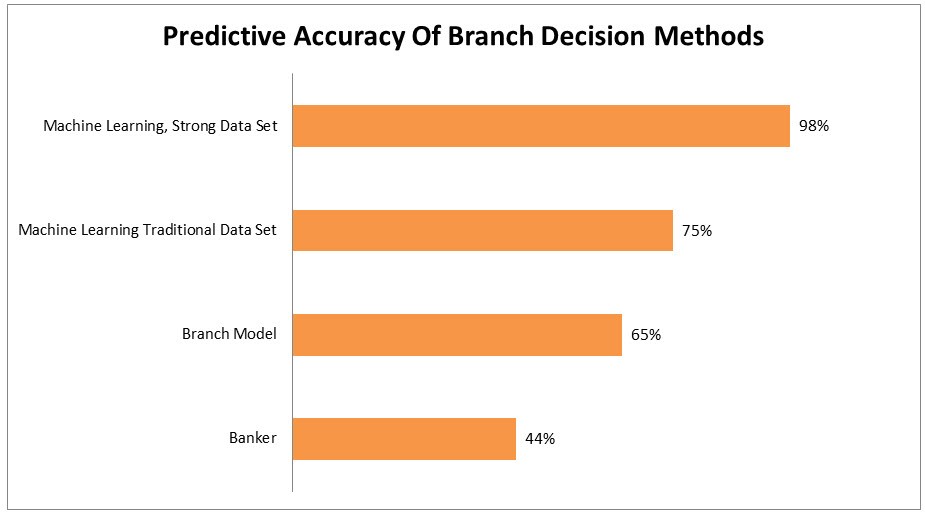
It turns out that bankers were the least accurate of the three methods with only a 44% chance of accurately predicting branch profitability given the data on an area. To put that in perspective, that is less than the odds of a coin flip. For the sake of brevity, the general problem in retrospect was twofold. These bankers either didn’t place the appropriate weight on the data or were easily biased. That is, they didn’t appropriately consider things like unemployment, household income growth, and others. Plus, they were swayed by other factors such as new development and competition.
For example, if you give bankers all the information except competition location and new development information, they will make a prediction. However, if you give them new development information, they will place too great a weight on that factor to influence their decision towards the area of new development such as a new retail center or housing project. Conversely, if you provide all the information except competition location and then give the locations of other banks, bankers will tend to want to locate AWAY from other banks.
It turns out that in both cases, the experienced banker decision is the opposite of what you want to do. While new development can help a branch’s profitability, it also can hurt it, and in a majority of cases, it was a non-factor. Competition is a clearer example as it is positively correlated to branch profitability. A cluster of branches from different banks usually is a predictive factor to profitability – the opposite conclusion than what most bankers believe to be true.
The Branch Models
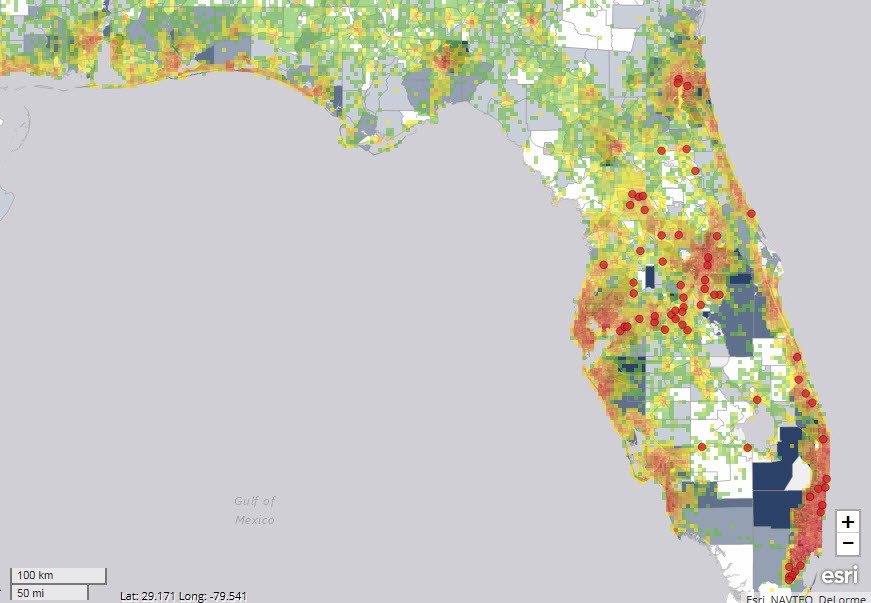
When experienced bankers start to use branch models, accuracy improves to the point where bankers can predict a branch’s profitability in about 65% of the cases. That is a huge improvement over the big thumb approach and is at least directionally accurate. What you get is something similar to the heat map below that shows our branches and profitable areas based on demographics, business formation, business wealth, economic and traffic factors.
If you consider a de novo branch is at least a five million dollar investment, it pays to get this one decision correct at least a majority of the time.
Machine Learning Branch Analysis
Whereas most branch models were created using static statistical analysis that looks at a set of essential factors and weighs each factor accordingly, models that learn from the data are under no such constraint. Whereas a traditional branch model could be based on data from another state or dataset that is 15 years old though, machine learning-driven models can be custom fit to an optimized data set that best predicts the future. What you can achieve is a dynamic branching model that can be accurate 98% of the time. Another way to look at this is by using machine learning, bankers can reduce risk by $1.7mm per branch decision. That is significant for any sized bank, but it could be the decision between success and failure if you are thinking about your fourth or fifth branch.
What Machine Learning Taught Us about Branching
Utilizing machine learning intelligence opened our eyes in a number of different ways. The most important lessons were at the meta-level. We learned about learning. As any banker will tell you, branching is complex and while we always want to try to keep things simple, the world is complex. No surprise, branch profitability is complex and cannot be accurately predicted by intuition or a limited set of parameters. For every branch decision that is a “no brainer” that both a banker and machine learning can accurately predict, it turns out there are at least two decisions that are tough calls and requires the accuracy of a more complex model.
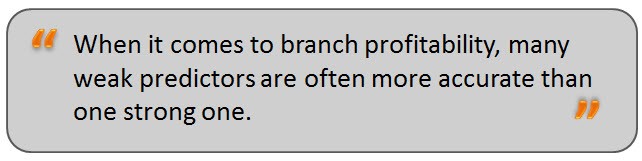
Another major lesson which is an offshoot of the above is that in the past we have discarded many weak parameters such as the standard deviation of traffic flow as being not important. While true, if you take the standard deviation of traffic, the direction your branch main entrance is facing (south is likely the best), the number of available parking spaces, the distance of those parking spaces from the main entrance, and if you have ATMs out front (you should), then all those little factors start to approximate the household density function (which has traditionally been the main driver of branch profitability). In short, when it comes to branch profitability, many weak predictors are often more accurate than one strong one.
Once you get into the realm of weak predictors, a lot of little things matter. If you have a fireplace or a video wall, line of sight to the teller platform, average temperature, if you are a business bank, the location of a Starbucks, the amount of ancillary foot traffic, business formation growth rate, the number of entrances to the property, and even the average speed of broadband in the service area all have an influence on profitability and can now be included in the model whereas before they might have been dismissed.
It can even get more granular. While any banker or branch model will tell you that traffic is important, traffic around 3 pm often tends to be most important. While the size of a household is important you don’t want too big or too small.
Change happens, and when it does it has an impact on the predictive accuracy of a bank branch model. The types of products, the strength of the bank’s brand, the number of calling officers, the social network of those officers, if you have mobile banking and a wide array of other factors all have more of an influence than previously thought. As the industry and our society change, so too does the branching model.
Finally, there is an interesting lesson for our future. The accuracy of any machine learning model is based on the quality of the data set. Every time you add a branch to the data set, the accuracy of the model increases. Every time you add a new data set around a branch such as the education level of households or the number of businesses per industry in an area, the probability of accuracy increases. Thus, the function evolves such that the more branch data and more environmental data that you can analyze the more accurate your model becomes. Where before having an experienced banker or a branch modeling expert consultant was the key to success, now the major success factor is your ability to gather a variety of different data sets – the perfect function for a college student working on their master’s thesis.
Putting It into Action
The good news is that machine learning applications are easily available, inexpensive, and no longer takes a data scientist to run. Machine learning is also highly customized, so while a fireplace may help profitability in Kansas and even Tennessee, it may not in Florida. Running your existing branch data against the environmental data pertinent to each existing branch yields a particular fit that may or may not apply to the bank across the street due to their customer focus, product selection, or brand. However, that said there are certain branch data sets that are important to all so leveraging other banks or consultants with those data sets can also add to the accuracy.
The beauty of machine learning is that you can start with the data you have, load it in via spreadsheet and then add to it later. Since more and more data sets are becoming public, this is becoming easier and easier. Even if you can achieve 65% accuracy today, you can now do it at a fraction of the cost of what a traditional branch study takes, and you will now have the basis to hopefully move to 70% next year.
Turning the power of machine learning on branching decisions is just another example of how banking is becoming more quantitative and democratizing. Branch models used to be the realm of only the largest banks in the country. Now, the smallest community bank can often duplicate the predictive power of what Bank of America currently enjoys.