What Your Loan Pipeline Data Is Telling You

If you’re a bank that keeps a loan pipeline report, chances are you have some excellent data that will form the basis of making your bank more efficient. Of the key performance indicators (KPI), tracking length of time to close, approval rates, fall out rates and lost rates are likely on the top of your list to manage to. In this article, we look at some typical rates, what they might mean for your bank and how to improve the ever-important throughput.
Case Study of Pipeline KPIs
The column chart below is one bank’s data where we looked at all the loans that made the pipeline report and then looked at the percentage approved and compared it to those loans that fell out either due to losing the loan to another institution (40% of the fallout), withdrawn/tabled by the borrower (32%), declination (14%), insufficient information (10%) or other (4%).
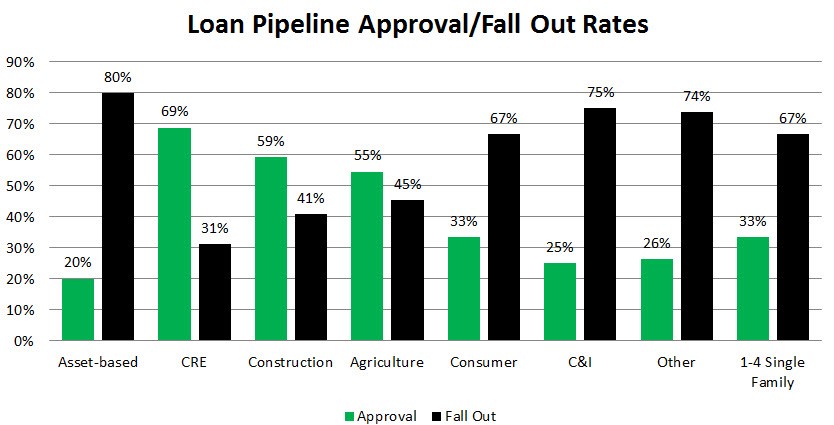
While each bank has different definitions of what constitutes the above categories of fallout loans our point would be the same if the bank is consistent. For this bank, a lending category such as asset-based lending
has a high fall-out rate compared to commercial real estate (“CRE”). We will analyze the fallout data in a future article and discuss how to solve common problems, but today we just wanted to focus on a single aspect of loan pipeline management – having large differences in approval and fallout rates between lending categories highlights issues that can be corrected.
What Fallout Rates Can Tell You
In this particular case, the bank devoted a large number of resources to CRE and ended up getting efficient “pull-through” rates, where the loans presented, had both a high probability of getting approved and a high probability of completing the underwriting process, accepting the loan and closing.
In our case study today, we see the opposite of CRE in the C&I category. This department has almost an equal amount of resources but has more than double the fallout rate. From the data, this is either a problem with marketing, sales, loan selection, or underwriting. In this case, it turns out that it’s a little bit of each. The bank was marketing to the wrong customers, underwriting had a statistical bias against C&I credit and since many of the credits were lines of credit, there was a higher than average withdrawal rate when the customer found out about the terms and conditions.
Putting This into Acton
Look at your bank’s pipeline data and see how it compares across lending categories. Large differences indicate an inefficient process and potentially a misallocation of resources. Identify the reasons why you have high fallout and correct them. If you do, your loan originations will go up while your customer acquisition costs will be reduced – all resulting in a more efficient bank.