Why Your Loan Terms Could Be Hurting Your Bank

The average commercial loan term for amortizing credit facilities at community banks is between four and five years. Banks need to understand the optimal loan term for amortizing credits to maximize profit and minimize risk. We analyzed the average community bank’s preferred loan term based on risk (probability of default, loss given default, and expected loss) and on profit (ROE). The results may be surprising to many bankers.
Commercial Loan Vintage Analysis
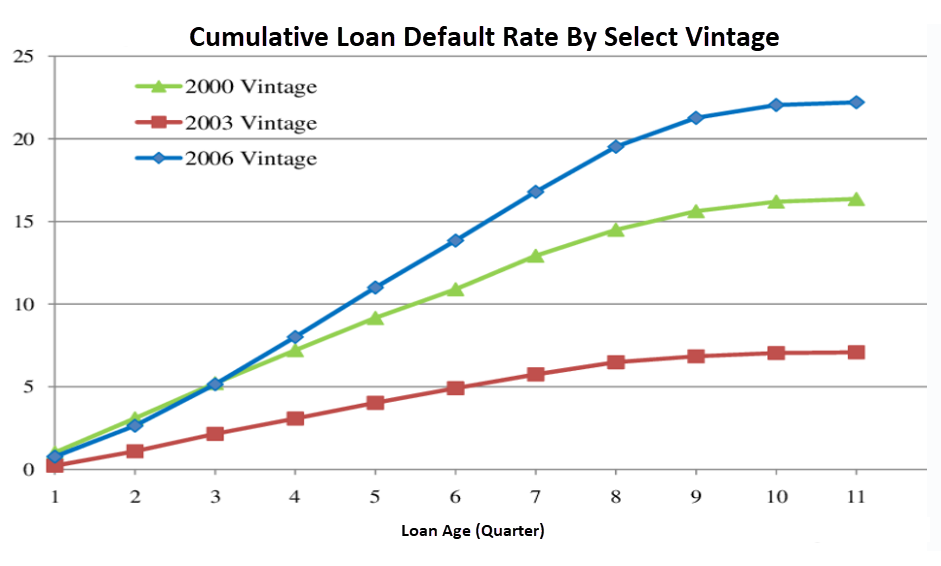
Vintage analysis offers bankers a perspective on the risk and profits of loans based on loan maturation. Vintage analysis groups loans in a specific period and tracks performance through the life of the loan. The pools can be analyzed for delinquencies, payoff trends, and losses (typically charge-offs). To properly use vintage analysis, changes in external factors that do not relate to maturation must be controlled. For example, loans originated in 2006 would show credit stress two to four years later. But, that stress would largely be attributed to the recession that followed rather than the natural maturation of a typical pool. Further, different credit grades within the vintage pool will exhibit different vintage behavior. It is essential to pool loans with similar credit grades.
The graph below shows an example of a vintage pool cumulative default rate of three vintage loan pools. What is common in most vintage risk analyses is that risk (as measured by default or write-offs) starts low, accelerates, and then flattens again.
The Importance of Loan Amortization
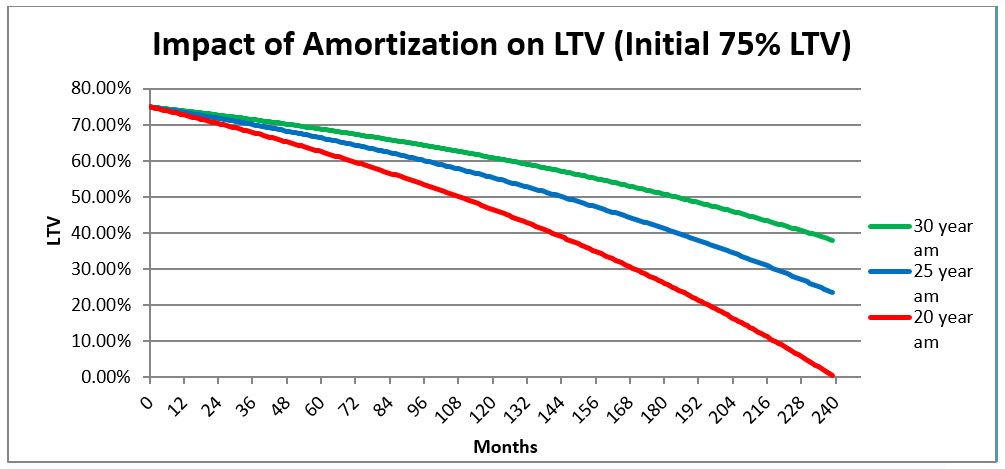
Most community bank term loans amortize based on a mortgage calculation. Mortgage amortization is a tricky mathematical formula. Under that formula, very little of the loan is amortized initially, and substantial amounts are amortized near the end of the loan. We observe that community banks focus especially on initial LTV and amortization periods but then set suboptimal loan terms. The vast amount of principal reduction never occurs if lenders set balloons before the pivotal point in the loan amortization schedule. Further, the mathematical difference in amortization is less significant between longer amortization terms than shorter amortization terms (for example, the LTV difference over time is more significant between ten and 15-year am, versus 25 and 30-year am).
Below is a graph showing an initial 75% LTV loan and three different amortization periods (20 years, 25 years, and 30 years). Strictly from an LTV risk to the lender, most of the risk exposure is in the initial term of the loan (one to seven years). The graph shows that little amortization occurs until about seven years into a loan on either a 20, 25, or 30-year am schedule. On a 25-year amortization, only 4% of the loan is amortized over the first two years, but 27% of the loan is amortized over the first ten years.
Loan Profitability
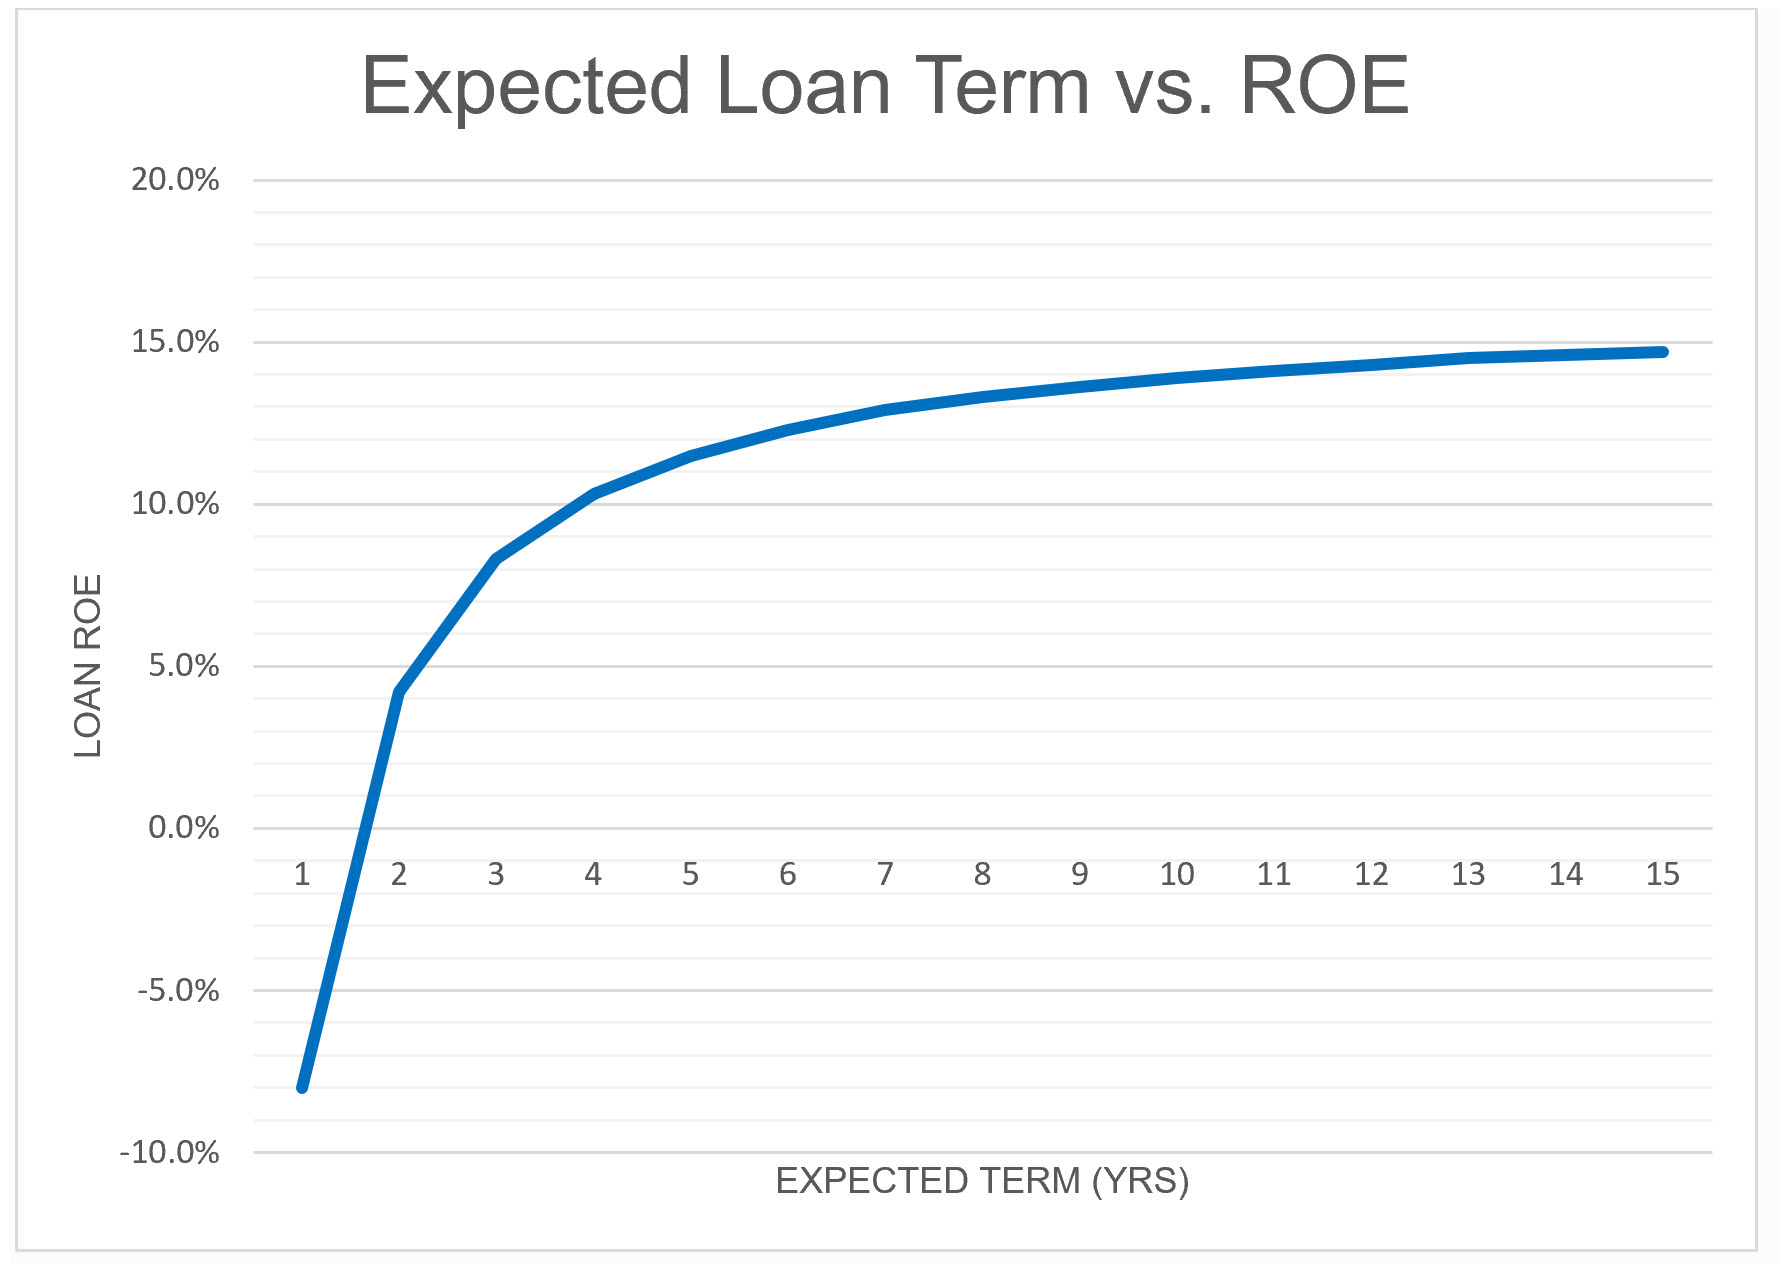
Because commercial loans are relatively expensive to source, negotiate and book, long-term loans are typically more profitable for banks. It is a longer set of cash flows for a bank to make money. A ten year loan provides double the cash flows as a five-year loan. Conversely, short-term loans can be a serious drain on bank earnings. The graph below shows the results from our modeling of commercial loan ROE. Because of the high direct and indirect costs of booking a new credit relationship, loans generally exhibit a negative ROE (risk-adjusted return on capital, or RAROC) in the first year or two and still subtract shareholder value in year three. The loans become more profitable with maturation, and the ROE levels out after ten years.
Risk Analysis
Observing community bank vintage pools is preferable – But such data is not readily available. Instead, we analyzed losses and default rates in the CMBS market. This market tracks thousands of loans within each credit grade. The large volume of loans allows us to analyze vintages that are not affected by external factors that we want to control, such as deep recessions. The average CMBS per quarter default rates for 2012 to 2014 vintages are shown in the graph below.
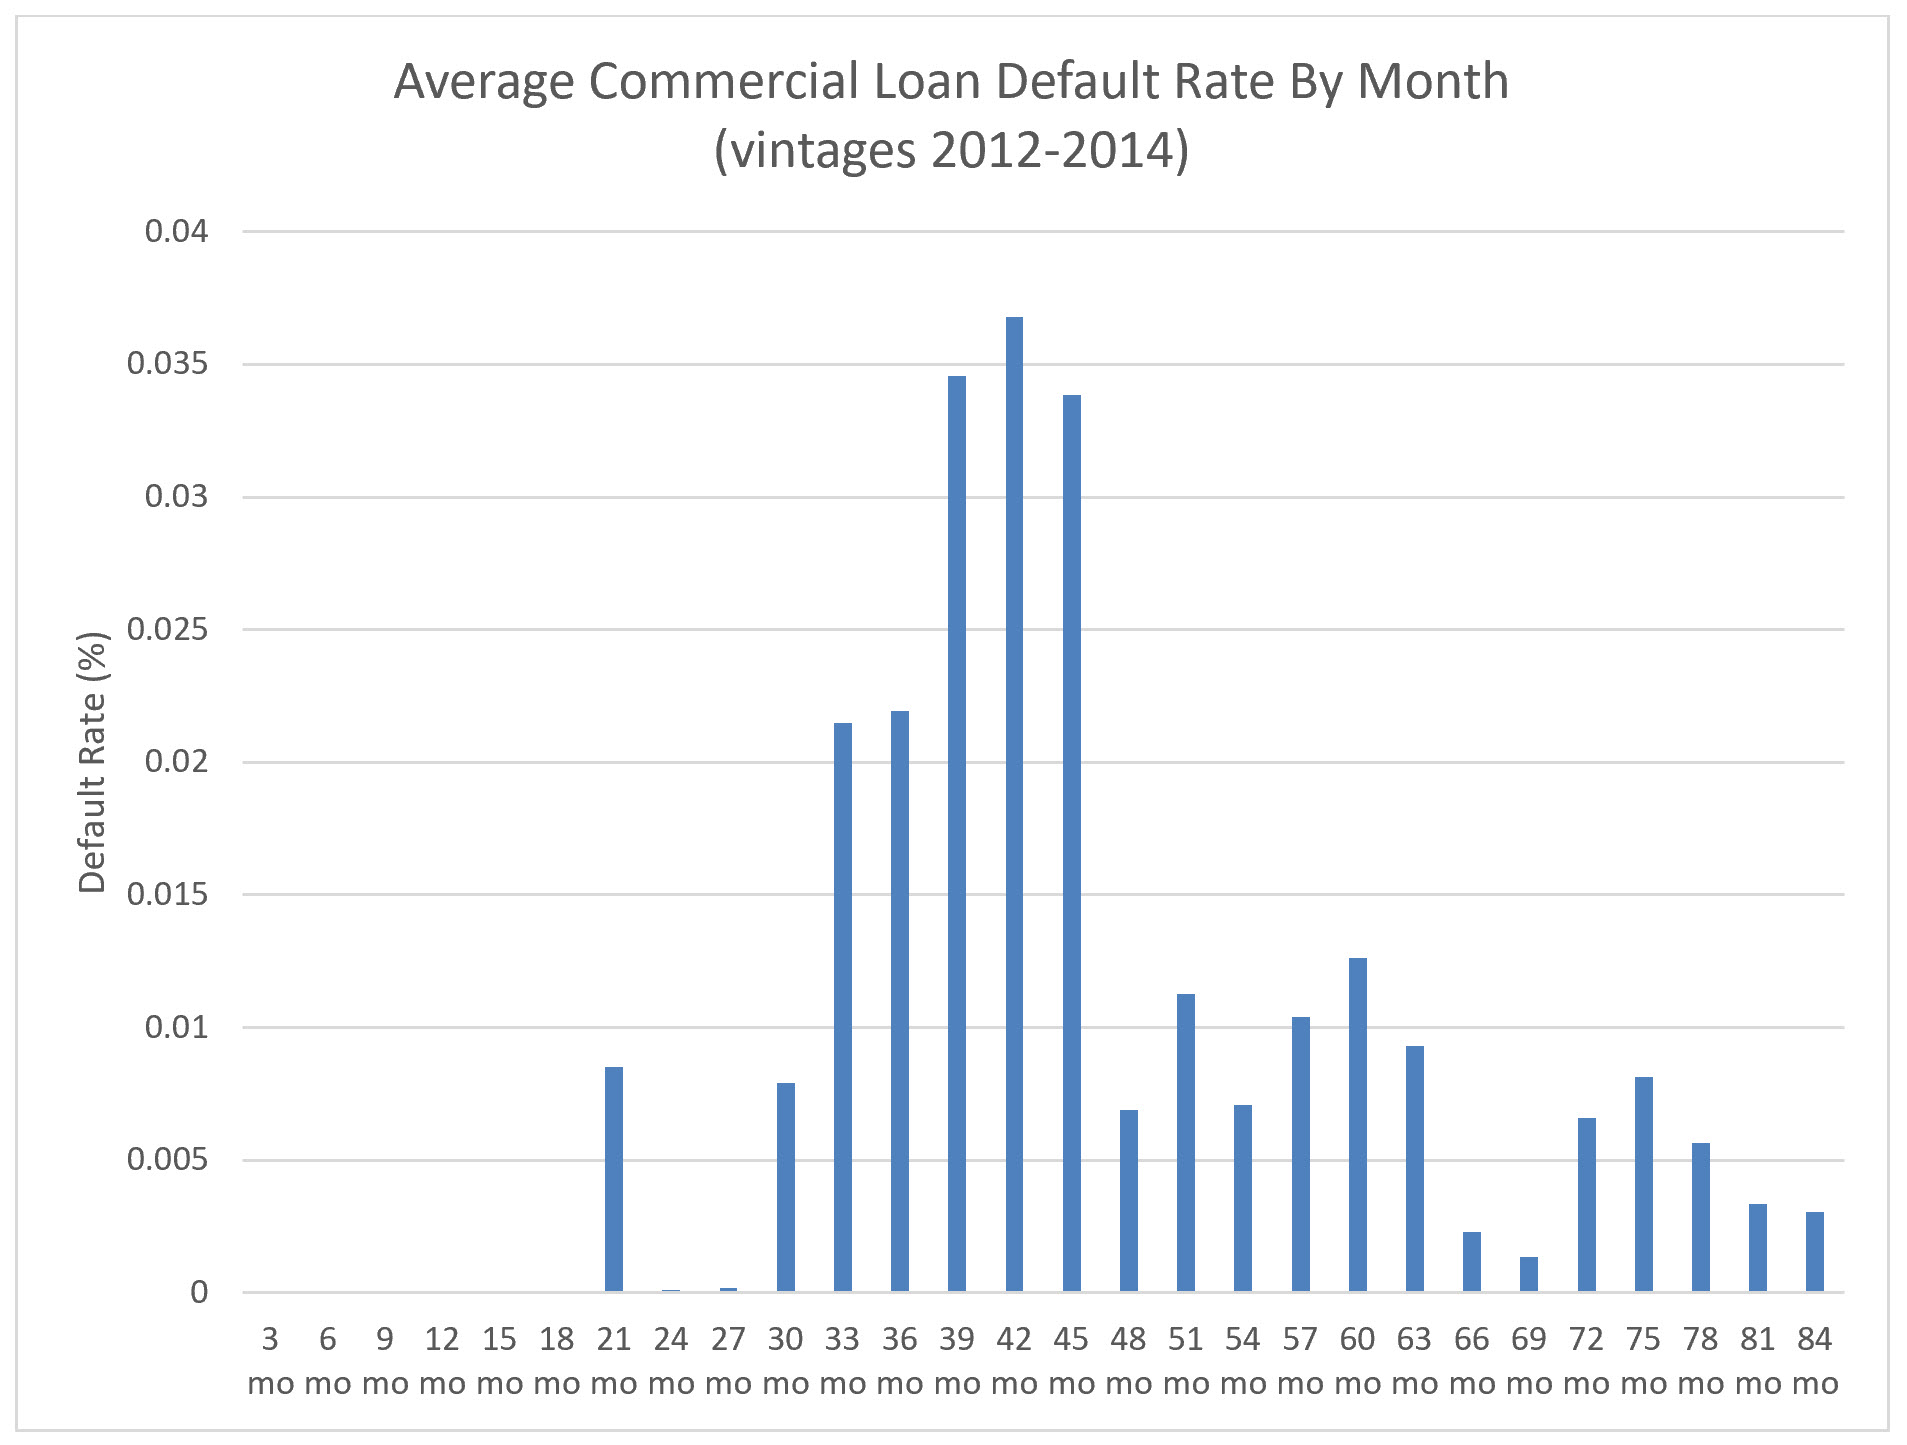
The average default rate per quarter in the CMBS market is low for the first two-and-a-half years and spikes after that and drops again after year five. To minimize risk, community banks would need to keep their loans to under two-and-a-half years in term. Unfortunately, that term is not commercially feasible and does not reflect borrowers’ demand.
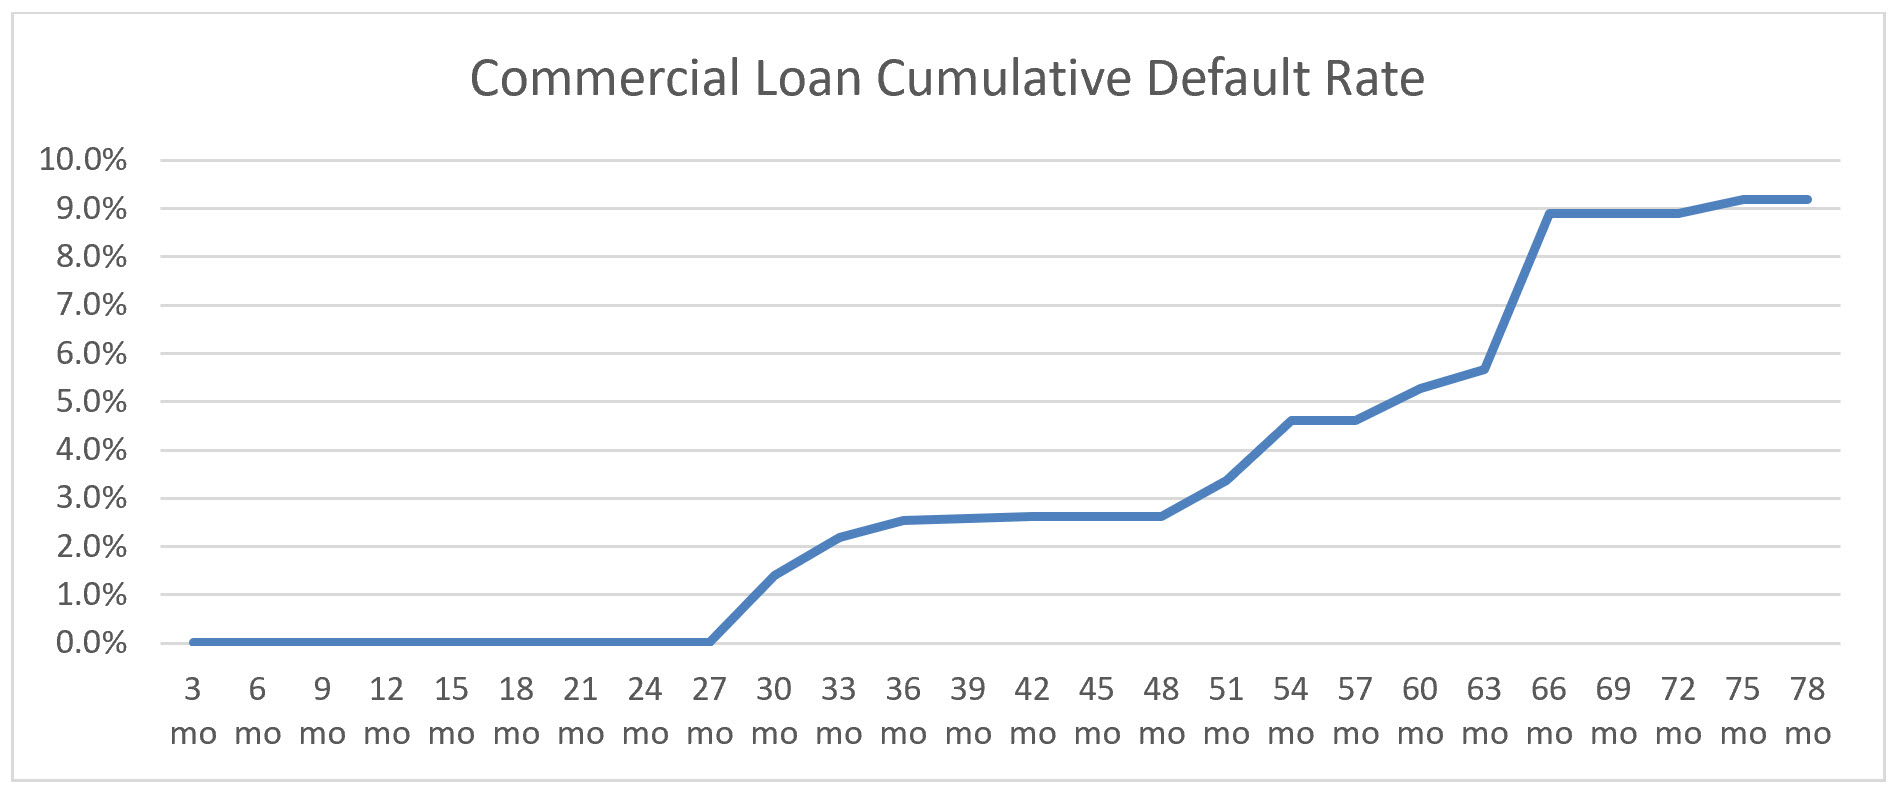
We can also measure cumulative rather than per quarter default rates. The graph below shows cumulative default rates (measured as 60-day delinquency) for multi-family vintage. Lenders would want to set the loan term where this graph is flat (delinquencies do not accumulate). This graph shows that from a risk perspective, banks want to set terms at two years, or six-and-a-half years and longer. Again, unfortunately, two-year terms are not in demand by borrowers.
The Optimal Loan Term
While the average commercial loan term at community banks is between four and five years at inception, the data shows that this term does not optimize risk and profit. The credit risk declines for lenders after five years when default rates decline and LTV drops more precipitously because of mortgage-style amortization schedules. Further, profitability on an average-sized term loan is achieved well past five years, and in fact, past ten years. While the optimal term for each bank and borrower will differ, the data shows that for amortizing loans, where credit risk is bankable (low probability of default and acceptable initial LTV), the optimal term banks is somewhere between seven and 12 years.