
3Q 2026 Banking Performance: 5 Insights to Know

Third-quarter call reports came in last week and there are a couple of trends worth highlighting for executive management at community banks. Against the backdrop of the Midterms, the theme is emerging that credit remains remarkably well behaved. Loans and deposits continued to grow, and earnings are ahead of last year. Despite the good news, there are five important lessons to take away from the data that every bank executive should know. We look at 3Q 2026 banking performance and break down the top insights.
3Q 2026 Banking Performance
Banking is down to 4,204 banks, down 35 banks from last quarter and the lowest since 1888. This is from a high of 30,456 from 1921. In terms of bankers, we now have the fewest since 2003 at 2.02 million, or down 13,003 from last quarter. Citi and Wells Fargo led the way with the most layoffs/attrition at 2,555 and 2,554, respectively.
The industry posted a median return on equity (ROE) of 12.01%, up from 11.78% last quarter, and average return on assets (ROA) rose to 1.36% from 1.34%. Banks over $1T performed best, driven by trading and investment banking gains, while banks with $50B to $99B in assets and those below $250mm underperformed. Community banks, which we define as those under $25B, outperformed the industry with a 12.36% ROE.
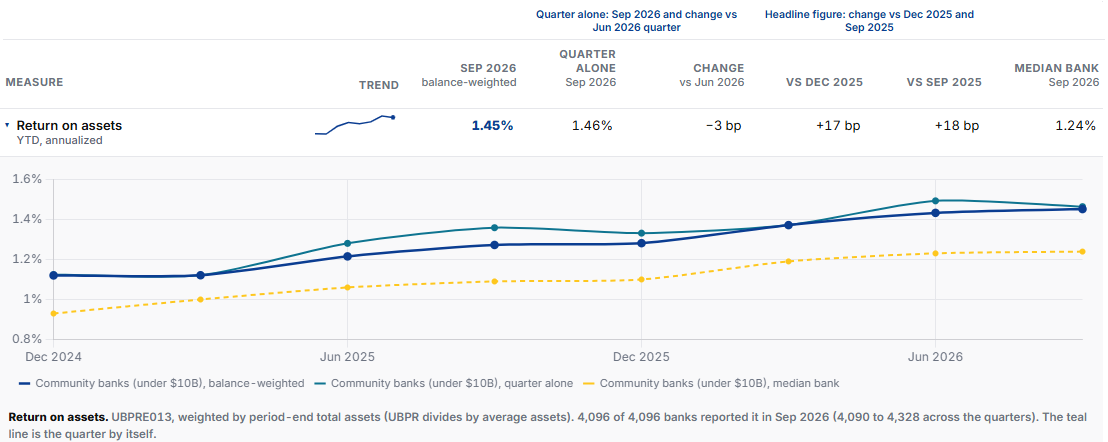
In terms of asset growth, loans grew at 1.89% for the quarter, which was slower than last quarter’s pace of 1.81%, while assets registered a 0.71% QoQ growth rate, which was much slower than last quarter’s 1.21% pace. Eight of the 19 loan categories hit all time highs to include 1-4 first lien loans, credit cards, investor CRE, owner occupied CRE, multifamily and farmland. One interesting note is that home equity line usage utilization climbed to 41.53%, the highest in six years.
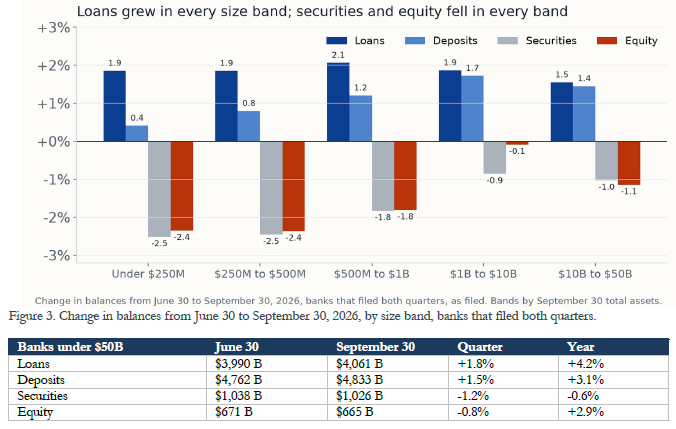
Deposits grew at a 0.85% rate for the quarter, which was the same as last quarter, while total liabilities grew at 1.03%, which was slower than the previous quarter’s 1.33% quarterly pace.
However, the story is in the details.
Takeaway 5: What Drove Earnings
For 3Q 2026 banking performance, cost of funds increased 2 basis points (bps) to 1.95%, while yield on earnings assets increased 6 bps to an average of 6.01%. This increased net interest margin (NIM) by 4 bps, to 4.06%.
As readers know, measuring by NIM is fools’ gold, so looking deeper, credit remain relatively the same (more on this later), while the real earnings story was around efficiency as it dropped from 57.32% to 56.43%. Helping efficiency was greater use of technology (AI gains?), and greater assets/liabilities per branch and per employee.
Banks also increased their percentage of earning assets to non-earning assets, which also helped drive net income.
Takeaway 4: Liquidity Was Reduced
While greater earning assets helped net income, banks sacrificed liquidity. Cash and equivalents decreased 4.03% and securities decreased 1.09% (in part due to a negative mark-to-market). On a net basis, cash and securities came in at a recent low of 31.2% of assets (below) while pledged assets to total assets increased to 34%, up 37 bps from last quarter and above the 10Y average of about 30%.
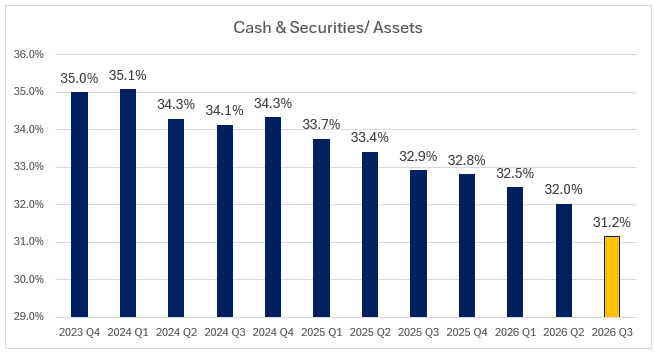
Given the volatility of this current Presidential administration, potentially rising yields, and the fact that we are likely on the backend of a credit cycle, banks may fare well increasing their liquidity. Unfortunately, the opposite is also happening on deposits as loans-to-deposits reached the highest level since 1Q of 2000 at 66.85%. Loans-to-core deposits hit a similar high at 81.9%. However, the industry average is misleading as many community bank size cohorts are now above 80% on an LTD basis, and above 96% on a loan-to-core-deposit basis.
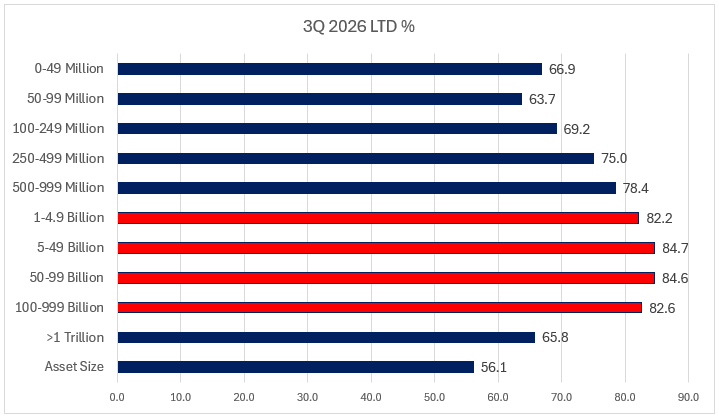
Once you get above a 75% level, banks lose optionality when pricing deposits and it likely means deposit costs will be pressured up along with more reliance on the wholesale funding markets.
Banks that find themselves in this position need to devote more resources to deposit gathering and pricing as this deposit pressure is only expected to increase as the industry deals with third party agents and tokenization.
Takeaway 3: Deposit Management Is Improving
Another aspect of Q3 results worth understanding is the change in the structure of liabilities. Brokered deposits at banks under $10 billion declined from $163.6 billion to $145.1 billion, falling from 5.61% to 4.90% of deposits. Reciprocal deposits, meanwhile, increased from 7.22% to 7.38%. As companies like ModernFi lower the cost of reciprocal deposits, their use is increasing.
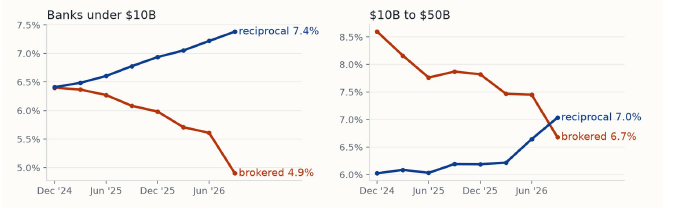
The more dominate change is the ROAD to Housing Act, enacted July 11, 2026, widened the exception that allows certain reciprocal deposits to remain outside the brokered-deposit classification. September Call Reports therefore reflect a regulatory-definition change as well as changes in actual funding behavior.
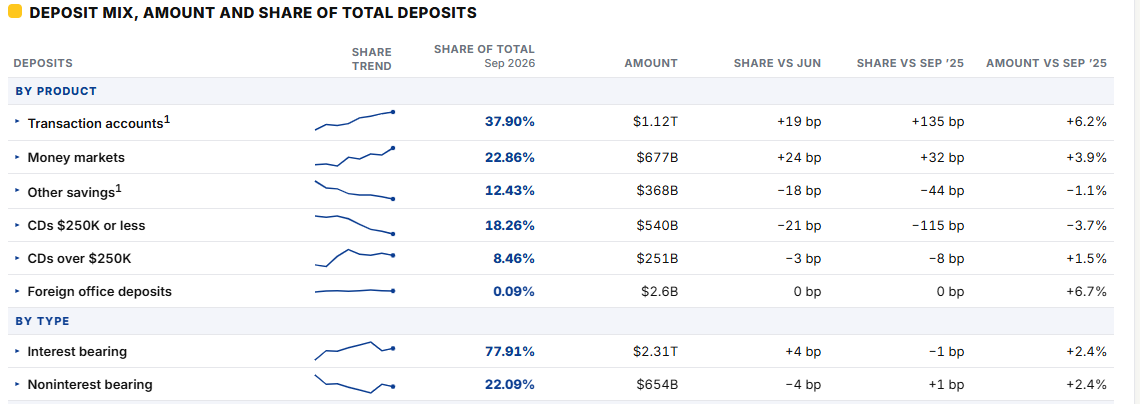
Tactically, community banks did a good job at improving their deposit mix as banks increased transaction accounts by an impressive 19 bps. Money markets increased 24 bps while CDs decreased (below).
Takeaway 2: Credit
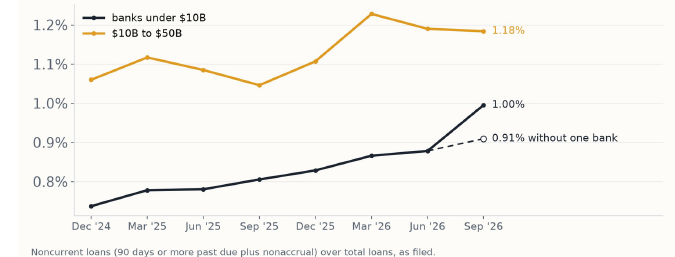
Noncurrent loans at banks under $10 billion increased from 0.88% to 1.00%. But one savings bank with a large multifamily portfolio accounted for much of that movement. Remove that institution and noncurrent loans were only 0.91%.
Other real estate owned (OREO) increased 10.34%, the largest gain since 3Q 2010. This should make bankers raise an eyebrow.
If you want to raise another eyebrow over credit, consider that banks this quarter fall into two camps – those that want to increase CRE exposure and those that don’t. Banks like Wells Fargo, JP Morgan Chase, Truist, Huntington (the most aggressive) and Capital One all deliberately decided to shrink their investor CRE portfolios. Meanwhile, banks like Bank of America (the most aggressive but holds the lowest CRE ratio of any major bank), US Bank and PNC, decided to grow their portfolio. From an industry standpoint, 52% of banks had investor CRE growth, while 48% shrunk their portfolio.
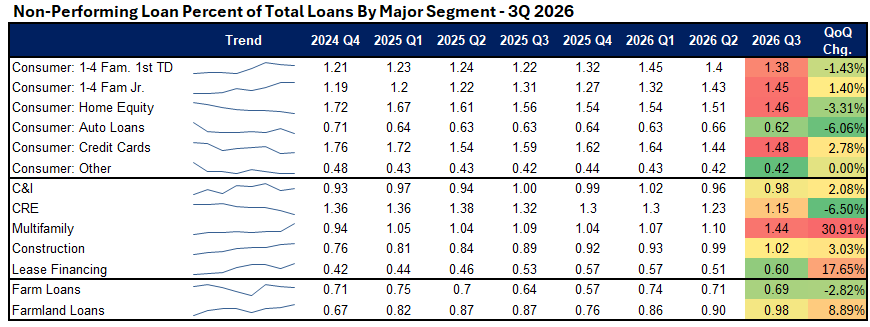
Community banks certainly shouldn’t be complacent about credit. There are plenty of reasons to watch CRE, multifamily, consumer credit and individual borrower performance carefully. We did a complete analysis of probabilities of default and loss given default for the next year HERE. The short story here is that Q3 doesn’t show the broad-based credit event that many pundits have feared but there are reasons for caution and adding more resources to credit monitoring and management.
Takeaway 1: Fixed Rate Risk
An interesting number is the 11.02% median unrealized securities loss as a percentage of Tier 1 capital for banks under $50 billion at September 30. Last quarter, it was only 6.70%.
On the loan side, it is a similar story. While banks have gotten better at not booking fixed rate loans longer than 5Ys, they have been increasing the number of 5Y fixed rate loans. Fixed rate loans 3Ys and longer compose about 36.7% of the average bank portfolio generating a fair amount of potential interest rate risk when combined with the securities portfolio.
Bankers sometimes dismiss unrealized bond and loan losses because the bank doesn’t have to sell the asset. Technically, this is true, but economically, it’s a problem.
With rising credit volatility, potentially rising rates and an increased value around liquidity driven by deposit competition and the popularity of agents, a mark-to-market loss on bonds and loans limits a bank’s optionality.
Strategic balance sheet flexibility has real economic value.
This is why we think boards and ALCO committees should stop looking at fixed rate exposure simply as an accounting issue and start thinking of it more as a strategic issue.
Across banks under $50 billion, more than 1,695 institutions had unrealized securities and loan mark-to-market above 15% of Tier 1 capital. Of those, 907 banks also had funding costs that either declined less than the median bank’s 34 basis points since December 2024 or increased. These banks, in particular, are strategically constrained and will have to devote outsized resources to defending their balance sheet from the competition. The competitive gap among these community banks and their peers could widen over the next several quarters.
Banks with inexpensive deposits, liquidity and manageable fixed rate positions can play offense.
Here’s another concept every ALCO should consider – Measure the fixed rate exposure issues in years of earnings, not just dollars or capital ratios. For example, the median bank under $50 billion has unrealized securities losses equal to approximately 0.9 years of annualized pretax income. For the 907 constrained banks, that rises to 2.3 years. Among constrained banks with positive pretax earnings, 37% would require more than three years of pretax income to absorb their securities losses if those losses were realized.
This places fixed rate risk in a different perspective. A $20mm negative mark-to-market on bonds and loans is an accounting construct. A loss represents 2.3 years of pretax earnings is a strategic framing. Through proper loan structuring, bond portfolio management and hedging, higher earnings could have been achieved.
Putting These 3Q 2026 Banking Performance Insights Into Action
The industry’s fundamentals remain surprisingly resilient. Earnings are higher than a year ago. Loans are growing. Deposits are growing. Credit deterioration remains relatively contained.
Despite these seemingly good times, a majority of banks are producing under their cost of capital. These banks are growing themselves out of existence. Getting your return above your cost of capital should be every bank’s primary focus.
The winning banks over the next several years won’t necessarily be the banks with the highest margins. They will be the banks that create customer and shareholder value by focusing on risk-adjusted return derived from customer profitability while providing product and service value to the customer.
Banks that do this while managing credit, interest rate risk and balance-sheet optionality will also be in a position to say “yes” when everyone else is forced to say “no.”