5 Things To Know About Bank Performance for 1Q 2026

Now that we have complete call report data, the banking industry unveils some tidbits of knowledge that has an impact on every bank’s positioning and strategy. In this article, we recap the major trends of the quarter and discuss what it means for a data-driven, strategically focused bank management team.
The Backdrop for Bank Performance for 1Q 2026
The conflict with Iran caused a “risk-off” environment in the first quarter for most of capital markets, driving up volatility, energy prices and inflation fears, which directly pressured yields higher. Unfortunately, almost every major market indicator was inversely correlated to bank performance.
While 10Y Treasury yields dropped to 3.96% in February, they shot up to a high of 4.44% at the end of March. The 2Y followed in similar suit but rose more to 3.98% causing a yield curve flatting in the intermediate sector. Meanwhile, while the Federal Reserve kept the Fed Funds target range at 3.50% to 3.75%, the Fed Funds Effective rate was 3.64% for the quarter and the 3-month Treasury Bill was often north of that raising money market fund rates and putting pressure on deposits.
Against that backdrop, let’s discuss our top five major takeaways from the quarter.
Insight 1: Growth Could Be Sowing The Seeds of Destruction
The insight here is that money is cheap, the world is riskier and some banks are not paying attention.
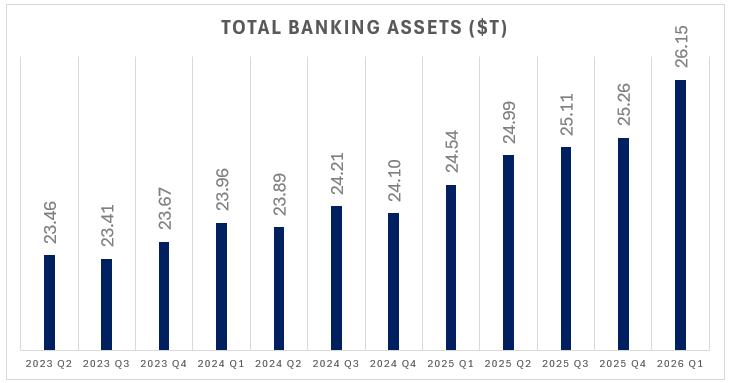
Assets grew at a mind-bending $888B, or 3.52%, to put us over $26T for the first time in banking history. More interesting is that this is the second largest gain ever recorded in modern banking with the exception of 1Q 2020 when the U.S. Government started to flood banking with pandemic money.
All this sounds like a round of high fives at the next board meeting, but that might be a mistake.
Most of the growth came in the form of trading assets for larger banks, but many community banks had stronger loan growth than core deposit growth by about double.
Almost equally eye-catching was the fact that deposits grew at $470.31B, or 53% of asset growth. This was the 6th highest quarter of deposit growth in history and only eclipsed by the five quarters during 2020-2021 pandemic era of cheap money.
Consider that the asset growth, and the deposit imbalance comes at a time when there is a “risk off” mentality in the capital markets. Higher volatility, lower liquidity, greater inflation, rising probabilities of default, higher loss given defaults and tighter pricing (despite the increase in risk) are the often the telltale signs of potential problems on the horizon. Unwittingly, banks are putting “risk on” and not only growing but putting their pedal to the metal.
The last time we saw this divergence of behavior was in 2007 when Wall St. got the message almost a year before Main St.
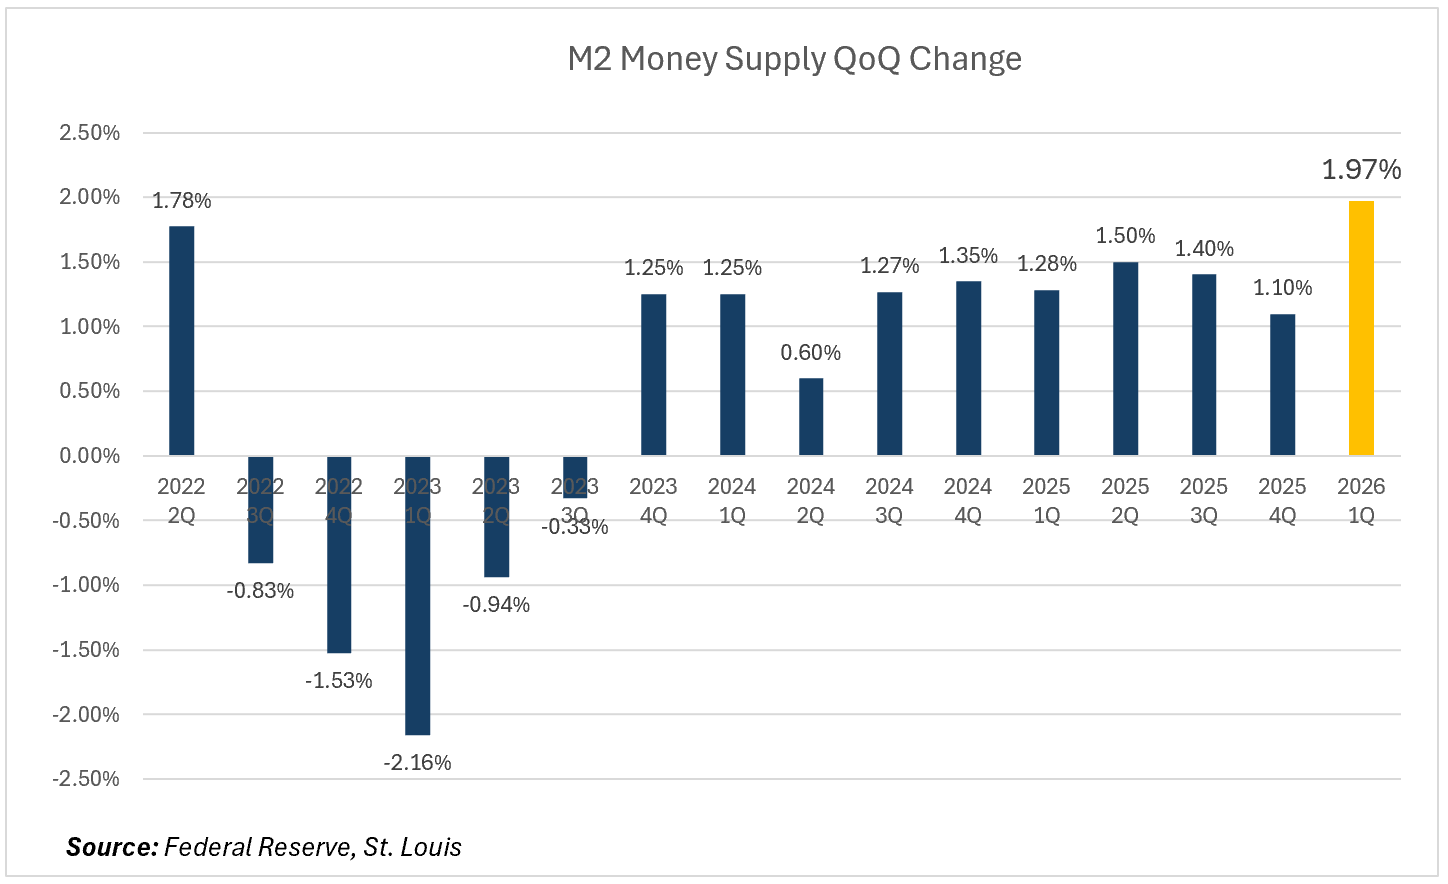
Further, consider that as of April 26, 2026, the seasonally adjusted M2 money supply reached new record of $22.7T, or $1.2T greater for the quarter. That is some of the highest money supply growth we have seen outside of the pandemic experience.
This might all end fine, but it will be luck if it does. If you have a probabilistic framework like we do, the odds are in favor of higher rates, more credit stress and market dislocation. High asset growth could sow the seeds of destruction in times like these.
In times of inflation, you would rather be a borrower than a lender.
There is a high probability that banks are being taken advantage of.
The likely strategic move here is to slow growth while moving up in credit quality, relieve funding pressure and reduce interest rate exposure.
Insight 2: Funding – Where Perception Formed the Reality
When it comes to bank performance for 1Q 2026, the industry-wide median cost of funds decreased from 2.10% from 4Q to 1.96% as deposit competition was less in many states. This is a non-intuitive insight which we will touch on in a moment.
The asset-weighted industry rate (which reflects the typical cost for a dollar of deposits across all banks) shows more variation by size segment.
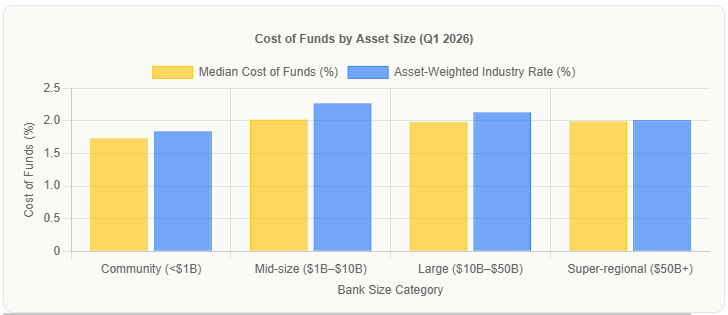
For community banks under $1B, the median cost of funds was 1.73% (asset-weighted 1.84%). Mid-size regionals ($1B–$10B) carried a median of 2.02% (asset-weighted 2.27%). Large regionals ($10B–$50B) had a median of 1.98% (asset-weighted 2.13%). Super-regionals over $50B saw a median of 1.99% (asset-weighted 2.01%).
About 75% of banks successfully repriced deposits downward despite a backdrop of rising rates, which is the interesting aspect of last quarter. Most banks faced a rising rate environment and more competition from money market funds by about three basis points. The reason for this is that greater uncertainty and higher volatility caused sentiment to be more negative and the average customer was less likely to move banks.
Banks either sensed this or got in their collective minds that bank competition for deposits were going to be less so lowered their deposit rates, particularly their deposit pricing exception customers.
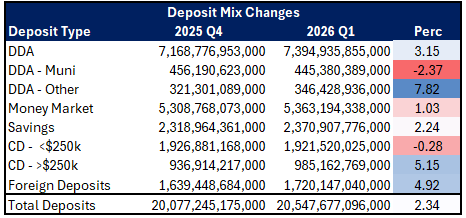
Banks grew core DDA balances a healthy 3.15%, while dropping more costly municipal balances. Unfortunately, because of our Insight #1, a portion of banks in the industry charged ahead growing loans 7%+ while deposit growth grew around 2.5% for these banks. The added deposit pressure caused these banks to borrower more wholesale funds while offering more CD specials for larger accounts. This is not the positioning you want going into the back end of a credit cycle against potentially higher future rates. You want the opposite.
The takeaway point here is that banks are making certain assumptions about deposit issuance that may or may not be true. In one trend banks are lowering their rates in some markets because they believe competition is less. In another trend, banks are not paying enough attention to their product offerings and deposit mix adding greater sensitivity.
Insight 3: Owner Occupied Is Starting To Be a Problem
Banks largely price owner occupied real estate tighter than investor properties by a handful of basis points. This has been warranted as the probability of default has been lower for owner occupied commercial real estate (CRE) than investor properties. However, in a more volatile economy, the diversification of investor properties often helps credit performance.
Over the last two years, non-performing loans as a percent of total assets have been coming down for investor properties while going up for owner occupied properties. Jumping more than 12%, owner occupied had the second highest increase in delinquencies outside of agriculture loans. Banks need to relook at their underwriting criteria for owner occupied and adjust pricing to bring the risk-adjusted return on assets more together.
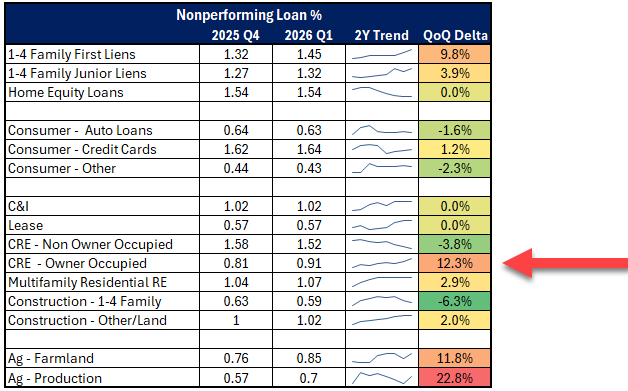
Banks with our Loan Command pricing model get the latest forward-looking probabilities of defaults and loss given defaults integrated into their relationship pricing, however, if you don’t have a dynamic risk-adjusted pricing model, our latest probabilities of default can be found HERE for reference. Banks looking for commercial loan pricing references, can find our latest 2Q forward-looking credit spreads HERE.
The action item here is to double-check your owner occupied CRE underwriting; while making sure you have a risk-adjusted return on capital pricing model that takes into account current probabilities of default.
Insight 4: NIM
The correlation between ROE and net interest margin (NIM) across US community banks is a weak positive correlation at 21%, using 1Q data. This quarter was another example of that counterintuitive finding in that NIM contracted from 3.07% to 2.99%, yet ROE went up 38bps to 12.4%.
While higher net interest margin (NIM) tends to associate with modestly higher ROE, the relationship is not strong and is often negative in times of credit stress. This is because NIM does not adjust for cost or credit charges.
This quarter, there was a particularly weak correlation between NIM and cost of funds as the relationship was inversely correlated at -9%. This near-zero correlation tells us that lower funding costs do NOT automatically translate to higher NIMs at the individual bank level. For this quarter, the asset side overwhelmed cost of funds movement at most banks.
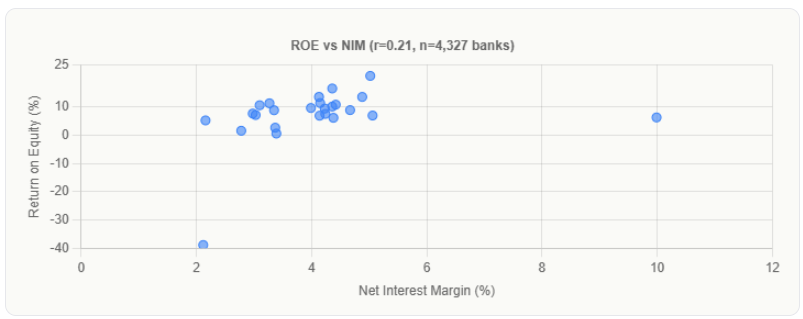
The insight here is that once again, the data shows that NIM is not the metric to manage when you are trying to effect earnings. Risk-adjusted ROE is a much better steering wheel.
Insight 5: Stop Playing With AI and Get Serious
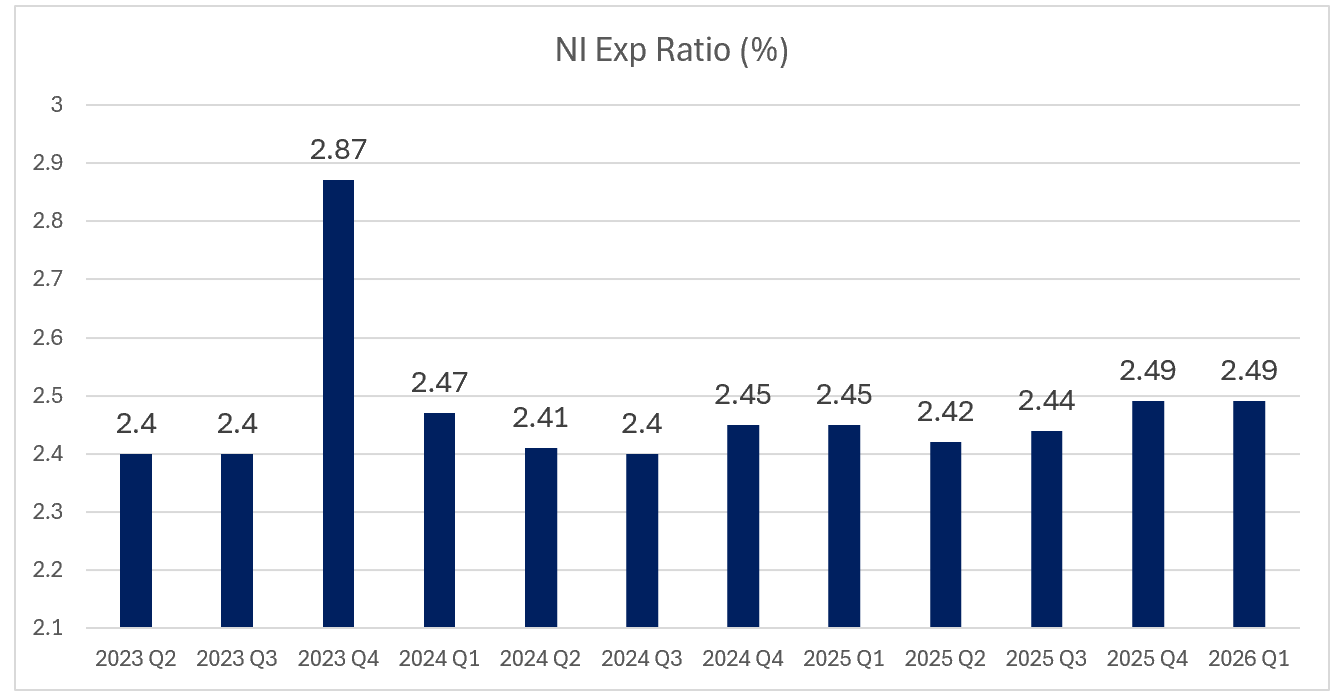
The efficiency ratio of the industry remained largely unchanged at a median of 56.4%. Top performing banks hovered below that while many $1B asset sized banks remain in the high 60s. Non-interest expense as a percentage of assets remained unchanged at 2.49%. Excluding the large banks, capitalized cost also remained largely unchanged QofQ and just slightly higher than early last year.
The insight here is the lack of AI action to produce tangible results. Most community banks are playing around with Copilot when they should be thinking bigger to lower their efficiency cost. An AI strategy should be able to be articulated to a bank’s board and staff. It is time to make enterprise-wide investments with the goal of reducing your efficiency ratio below 40%.
The winning strategy has emerged, and too many community banks are ignoring what is working successfully at other banks. The playbook is to invest in AI platforms that move the needle in efficiency:
- Cyber: Provide better and cheaper cyber defense.
- Risk/Operations: When it comes to cutting cost, leveraging AI and agentic AI for Reg E compliance and fraud has emerged as one of the most impactful starting use cases. For example, banks have far too many false positives in payment fraud review and account opening to the tune of 60%+ and it eats up FTEs. Use AI, gen AI and agentic AI to reduce the human workload by 50% or more. Once done, move onto other operational and risk management tasks as this has proven to be the lowest hanging fruit with the most stable double digit plus return.
Using AI to handle dispute resolution, investigations (evidence gathering and fraud determination), and case management are Reg E activities that should be intelligently automated.
3) Risk/Credit: Use AI to enable the credit underwriting and review process (but not loan decisioning). Banks that have done this are not only taking 20%+ of costs out of the system, but processing credit faster enabling better credit risk management.
One of the goals for this year should be to hire or develop someone in the organization that can talk to executives with a very clear framework and genuine authority about any given enterprise AI application. This person should be able to detail that they have tested the application, explain what AI can’t and cannot do, articulate how it fits into any new workflow, breakdown the implementation plan, present a budget and provide a timeline. This is the person that doesn’t exist in most banks, and it is the one very clearly needed.
Most banks are struggling with their business line not driving hard enough or grasping the technical details, IT not understanding the workflow and consultants that won’t get in the weeds for a reasonable price.
Putting These Insights Into Action
There is nothing wrong with using AI to make your employees more productive. However, many banks budgeted two or more rate cuts into their earnings and as we said last year, this is not a likely occurrence given the inflationary fiscal and monetary policy in addition to our international trade stance.
If you want to save this year’s budget, move quickly on leveraging AI for the above processes to reduce your bank’s efficiency ratio.
In today’s environment, strong growth and temporary funding relief can mask rising structural risk. The data points to a clear call to action. Slow the pace of asset growth, elevate credit quality, and actively manage funding mix before pressure builds. Reassess underwriting, especially in owner-occupied CRE, and ensure pricing reflects current risk realities. Most importantly, shift focus away from headline metrics like NIM and toward disciplined, risk-adjusted returns. Banks that act now, with intention and restraint, will be positioned to protect earnings, preserve capital, and outperform as conditions tighten.