3Q 2023 Commercial Loan Pricing Trends

Since our last update on 2Q credit HERE, 3Q commercial loan pricing trends start with a better economic picture as higher than-planned growth and softer inflationary data have changed part of the market’s outlook. The fear of recession has decreased in 3Q, and the new primary concern shifts back to interest rate risk and deposit cost management. This article provides an update on pricing trends driven by our Loan Command aggregated community bank data and highlights some working pricing ideas.
Executive Summary
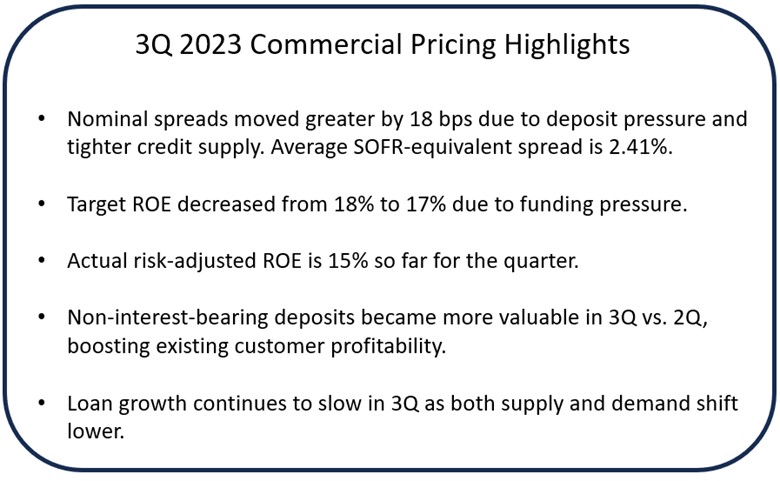
While bank loan pricing is nuanced – if you are looking for a headline number, weighted loan pricing increased by 18 basis points due to continued deposit pressure, a higher probability of default, and lower credit supply. The average SOFR-equivalent credit spread for loans in 3Q is approximately 2.41%, compared to about 2.23% last quarter. The 25-basis point (bps) increase in the target Fed Funds placed more pressure on the bank’s cost of funds but to a lesser degree than in quarters past. Because of this predictability, fixed-rate loans were more accurately priced, except for a few days in early August when we saw a 20bps jump in long-term rates. This factor alone was the single most significant contributor to higher loan pricing.
Loans priced to a Prime index increased three bps to an average of Prime + 0.17%. Fixed rates loans were priced to an average of 6.83%, for a SOFR-equivalent spread of approximately 2.58%. It is noted that for the first time in modern memory, we are seeing more loans priced to a 7% floor.
Further to this point, some banks started instituting floors in the 6.5% to 7.0% range. While this pricing methodology runs the risk of adverse selection, given current expected losses, this increase in pricing served to increase profitability.
Loan fees averaged approximately 31 basis points, up from 26 basis points in 2Q. This increase is being driven by lower competition and more frequent hedge fees.
However, some of this profitability is offset due to higher expected credit risk and deposit costs. Because of continued funding pressure, driven by a historic change of deposit mix from non-interest bearing to interest bearing, cost of funds increases are serving to decrease the net target return on equity (ROE) from 18% to 17%. Because of the loan mix, banks are currently pricing their weighted commercial portfolio to a 16% ROE, or under their target.
Regarding loan growth, lending continues to be at the slowest pace since 2008. Total industry loans grew 5.1% for the year compared to last year. A combination of credit concerns and funding pressure have most community banks focusing on their existing customers and moving away from new transaction-orientated clients. It should be noted that this growth is not even across the industry; smaller community banks are growing close to 10%, while larger banks are closer to 2%.
Consumer lending and commercial real estate are leading most of the growth, at 11% (driven mainly by keeping more mortgages on the balance sheet) and 8%, respectively.
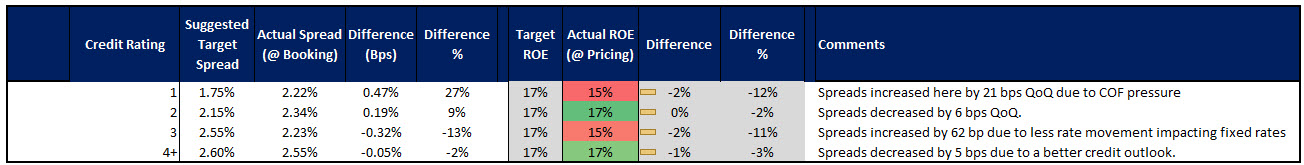
Commercial Loan Pricing By Credit Grade
You can tell that the bulk of the community bank industry still doesn’t have a risk-adjusted pricing model, as there are often anomalies when you stratify loans by credit rating. For example, loans with a credit grade of “2” are being priced at wider spreads than those with a credit grade of “3.” A grade “2” credit is often partially cash secured and has a much lower loss given default equating to a lower expected loss. Regardless, as long as banks are not losing deals, this broader pricing helped ROE.
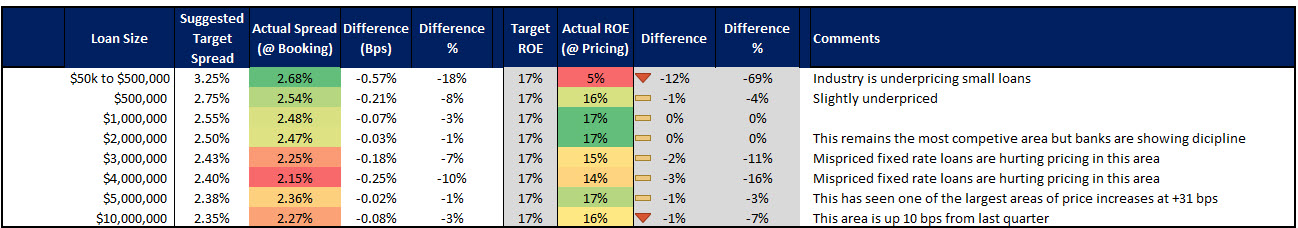
Commercial Loan Pricing By Loan Size
Without consistent Fed hikes and interest rate volatility, banks did a much better job at pricing this quarter. Spread compression in the past occurred around banks quoting and then holding constant fixed-rate loans resulting in near-2% credit spreads. Except in two size categories, most banks priced fixed-rate loans accurately, and we saw fewer free pricing options being given away.
Lower lending growth in key size categories, such as the $1 to $3M range, saw less competition so that banks could increase pricing.
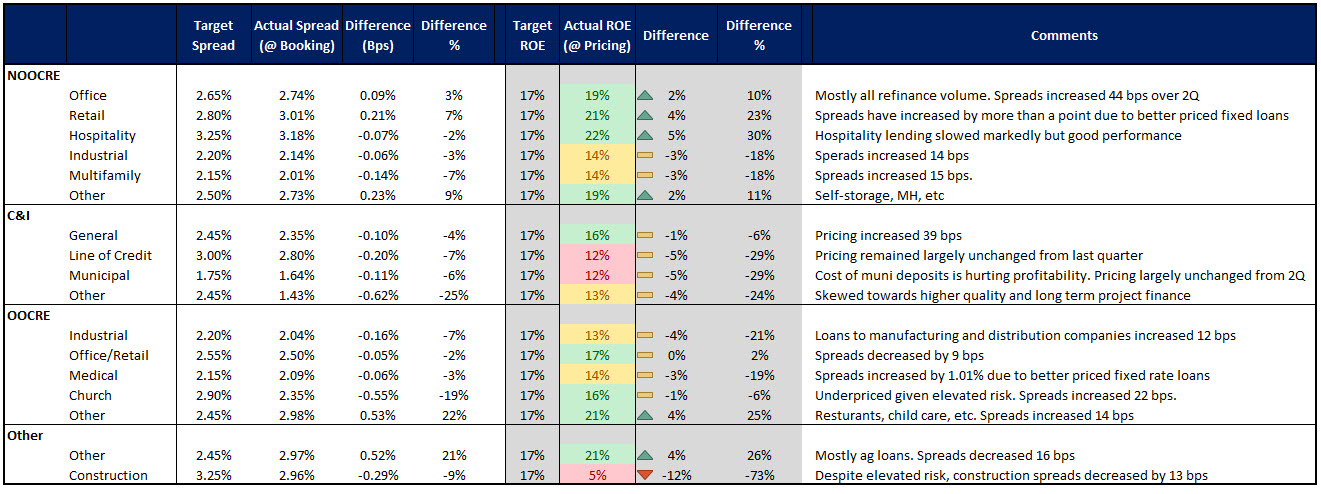
Commercial Loan Pricing by Sector
Driven by higher interest rates and lower vacancies, probabilities of default (POD) increased for construction, office, hospitality, and multifamily. Retail probabilities of default remain flat (compared to 2Q) but elevated. PODs for the industrial sector remain flat from 2Q at historically low levels. Demand for CRE and commercial & industrial (C&I) loans remains soft while supply remains tight. Banks continue to be reluctant to lend, a situation we don’t see changing for the rest of the year.
The above trends of PODs, combined with less competition and lower credit supply, have mainly driven loan pricing up. Construction was the most mispriced sector, while hospitality remains the widest priced (for the moment).
While spreads increased for industrial and multifamily loans, these sectors remained competitive and underpriced. Medical loans had the most significant increase in pricing due to better control of fixed-rate pricing (and less volatility in the market).
Non-real estate C&I loans also saw better pricing discipline from banks, with an increase in pricing of 39 bps. In the C&I sector, lines of credit remain costly due to structure and usage. Relatively higher deposit costs hurt municipal deposit facilities.
Putting This into Action
A slower-moving and more predictable market has helped banks price relationships more effectively in 3Q compared to 2Q. The slower manufacturing of credit and lower demand will continue to put upward pressure on pricing for the rest of this year. Banks should continue to pay close attention to PODs, loss-given defaults, expected losses, and delinquency trends to ensure they consider the latest credit data when allocating capital.
Due to the changing forward curve, a wider distribution of credit risk, and slower prepayment speeds increasing duration; community banks are encouraged to utilize a risk-adjusted loan pricing model such as Loan Command. At approximately $89 per person per month, the model pays for itself multiple times by pricing one loan more efficiently.