How Profitable is a Hedged Loan?

We have the privilege of using our risk-adjusted return on capital pricing (RAROC) model, and various other profitability tools, to analyze individual and multi-bank performance. Our data and analysis strongly suggest that banks that can measure instrument and relationship-level performance for return on assets (ROA) and return on equity (ROE) can improve simply by reallocating capital and resources to more profitable relationships. We sought to measure how hedged commercial loans (where interest rate risk is removed), credit margin is properly determined at inception, and maintained through the life of the loan, compared to that same bank’s non-hedged commercial loans.
Our results are insightful for many community banks who may be considering commercial loan hedging or those that are questioning the merit of continuing such a program. We believe that the results summarized in this article reflect the general state of the banking industry, and the lessons learned can be incorporated by most community banks in their marketing, pricing, and marketing/sales efforts.
The Bank
Our present case study is a regional bank with just over $23B in funded commercial loans. We reviewed just over 25.5k lending relationships and compared profits as contribution to overhead adjusted for fund transfer pricing. We removed any relationship that did not contain a funded loan. We specifically wanted to distinguish hedged loans versus unhedged loans and how this one specific product reflected on the bank’s profitability. This bank has been offering fixed-rate loans to clients both as hedged loans, and, on a limited and restricted basis, fixed on balance sheet.
Results of the Hedged Loan Profitability Analysis
The table below summarizes our findings. Out of the 25.5k loans, a little less than 5% are hedged loans. However, the hedged loans are on average $3.4mm in size compared to $781k in unhedged loans, and the hedged loans contributed almost 25% of annual profit for the bank. The average hedged loan generated $73.7k in profit – which is 6.4 times the average profit for an unhedged loan.
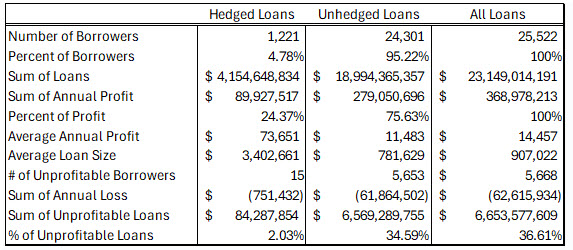
The important takeaway from the table above is not the sum of the profitability for hedged loans versus unhedged loans but percentage of the loans in the two groups that generate negative profit for the bank. Of the hedged loans, only 15 were unprofitable for the bank, versus 5.7k unprofitable unhedged loans.
The number of unprofitable loans is not germane, what matters is the amount of capital allocated to unprofitable loans. The total sum of unprofitable loan principal outstanding for hedged loans was just 2% of all hedged loans versus 34% for unhedged loans. Stated another way, the bank had $84mm in unprofitable hedged loans, and $6.6B in unprofitable unhedged loans. The hedged loans subtracted $751k in annual profit from the bank, but the unhedged loans subtracted $61.9mm in profit. The bank allocated 36.61% of its loans (a proxy for capital) to unprofitable clients (the vast majority to clients, 34.59% of all loans, where the loan was not hedged). An unintended result that would motivate any management team to reconsider upfront pricing and return analysis.
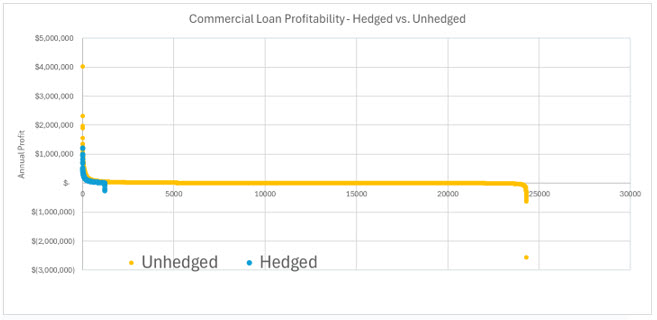
The graph of all hedged and unhedged loans with annual profitability is shown below. The graph shows very few unprofitable hedge loans (15 in total), and 5.7k in unprofitable unhedged loans, subtracting substantial amount of value (profit) from the bank. This phenomena requires some further analysis, explanation and discussion.
Why are so many of the unhedged loans so unprofitable for this bank? There are two major culprits. First, many of the unhedged and unprofitable loans are fixed-rate loans priced in a lower interest rate environment. These loans are now unprofitable because of the bank’s higher COF as the result of an upward shift in the yield curve. Second, we measured the profitability per client and the bank’s cost of deposit per relationship is a large factor. Some of the unprofitable unhedged loans suffer from high cost deposits. This second reason, also brought down the profitability for some hedged loans.
Some bankers will point out that the unprofitability of this bank’s current fixed rate loans was caused by an idiosyncratic event (a sudden shift in interest rates) that is not often repeated. But we believe that this is an incorrect argument. For as long as we have been studying bank profitability, both in up interest rate cycles and down cycle, interest rate risk has been a main culprit in depressing bank profitability. When interest rates rise, fixed-rate borrowers extend their loan duration. When interest rates decrease, fixed-rate borrowers refinance their loans to prevailing lower coupons. In any interest rate environment banks are generally disadvantaged without a hedging program. Fixed-rate, on balance sheet loans become one-way floaters that hurt bank profitability.
Conclusion
Our current analysis should be of interest to all community bankers. There are ample opportunities for the front line to add value by utilizing a commercial loan hedging program that can eliminate interest rate risk, mitigate credit risk, increase fee income, and extend lifetime value of a commercial client relationship. Since the vast majority of bank profitability is generated by just 10% of clients, the main goal in banking is to minimize the number and magnitude of unprofitable relationships. On balance sheet, fixed-rate loans are a major source of negative profitability for banks. This study did not specifically measure the potential driver of cross-sell and upsell potential from these hedged loans, which tend to be much longer and stickier relationships. But we will continue our analysis of these important concepts for community banks.