Bank Credit Outlook for Q2 and Updated PODs

The first quarter of 2026 has brought tariffs, a war, greater inflation/higher energy prices, AI-driven changes, more volatility and more uncertainty. Unfortunately, almost every aspect of this current environment is inversely correlated to bank performance. The bank credit outlook is highly volatile with a skew to the downside due to higher inflation to include higher interest costs. In this article, we update our forward-looking probabilities of default (PODs) and provide our analysis of what is ahead for bank credit.
Bank Credit Outlook Trend Summary
While the average 1Y forward-looking probability of default for the industry decreased by 9bps from the start of the year, this was mainly due to an improvement in commercial real estate (CRE), Federal Gov’t related credit, energy producers and defense contractors. For community banks, PODs approximately increased 15bps, or 6% driven by lending to agriculture, software, transportation and manufacturing.
The average 1Y forward probability of default at the end of 1Q was 2.48% in the U.S., or 51 basis points (bps) lower than last year. To put this in perspective, credit usually changes to an average of plus or minus 21 basis points each year against a long-term average POD for bank commercial credit of 2.19%.
Credit volatility is also seeing an increase. When liquidity and credit are plentiful, PODs tend to compress, and volatility is reduced. Now, the opposite is happening. As a result, almost every industry became more volatile. As an average, the two standard deviations are around 2.02%. This quarter, it is 3.17%.
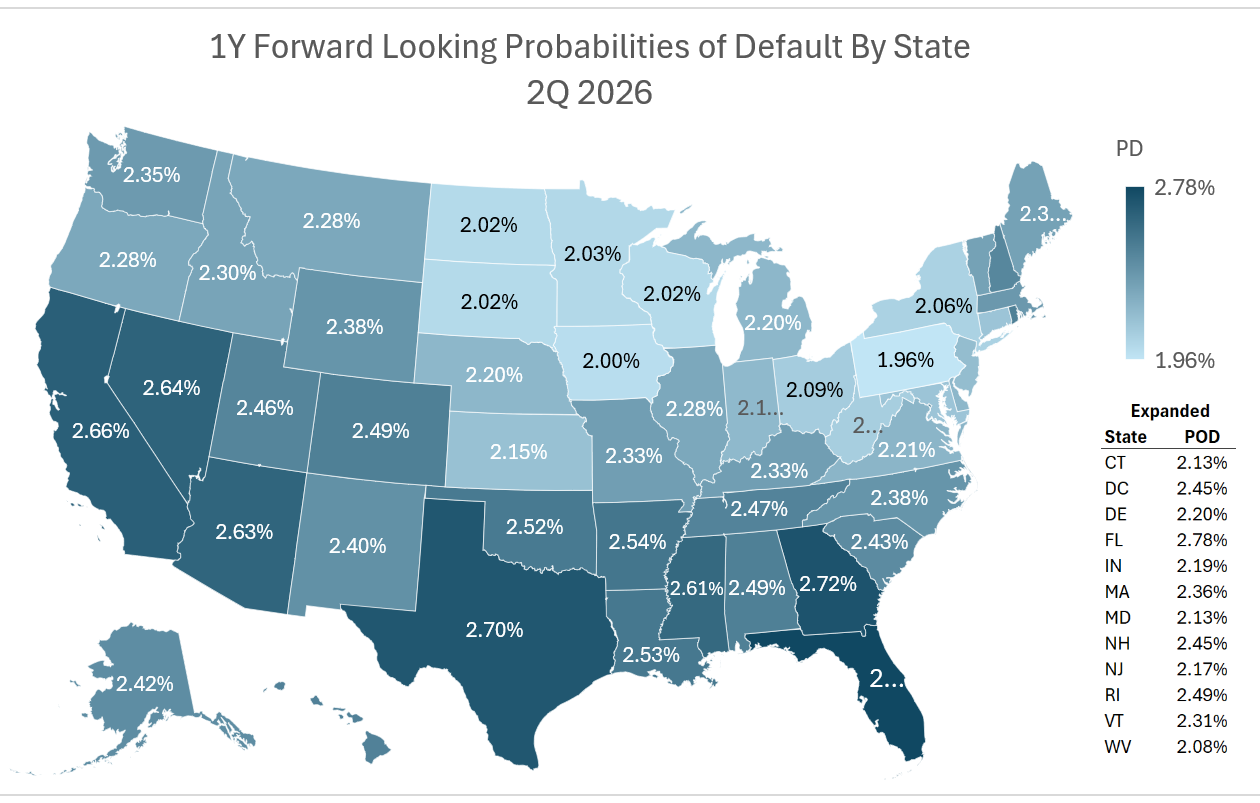
Commercial Credit Trends By State
Most states decreased their forward-looking probabilities of default on a year-over-year basis due to the gains made last year. However, this is starting to reverse for the quarter and further is exacerbated by community bank lending focus. Lending in FL, TX and California remain relatively high due to higher labor and transportation cost hurting strong manufacturing engines.
Below is a breakdown by state and their net probability of defaults.
Commercial Credit Trends by Industry
Most banks rate the bulk of their credits either a grade of “3” or a grade of “4.” The reality is that banks should be much more granular in their ratings to allocate capital more efficiently. More credit grades allow for a more accurate risk assessment, meaning a more appropriate loan loss allowance level.
The other common problem we see banks making in the second quarter is underpricing credit risk. In good times or times when credit is improving, banks tend to overprice credit risk. However, in worsening times, like now, banks tend to underprice credit risk and are not appreciating the impact of AI, energy and general inflation has on supply and revenue chains.
To better understand your credit grading and to see if you are over- or under- pricing, it helps to understand the PODs of your customers. An increase in PODs means an increase in expected losses. Commercial expected losses, considering collateral, went from and expected 85 bps at the start of the year to 125 bps in 2Q for the average community bank credit. With the industry’s average loan loss and lease allowance (ALLL) at 1.28%, including consumer, many banks will find themselves under-reserved in various sectors.
Banks should utilize probabilities of default and loss given default in their relationship profitability model such as our low cost Loan Command. If you are not using Loan Command, have your own model or just want to adjust your credit underwriting, you can also find all of our PODs, POD changes and volatilities in our free interactive tool (HERE). Below, are the 20 riskiest PODs from that tool by top-level NAICs code.
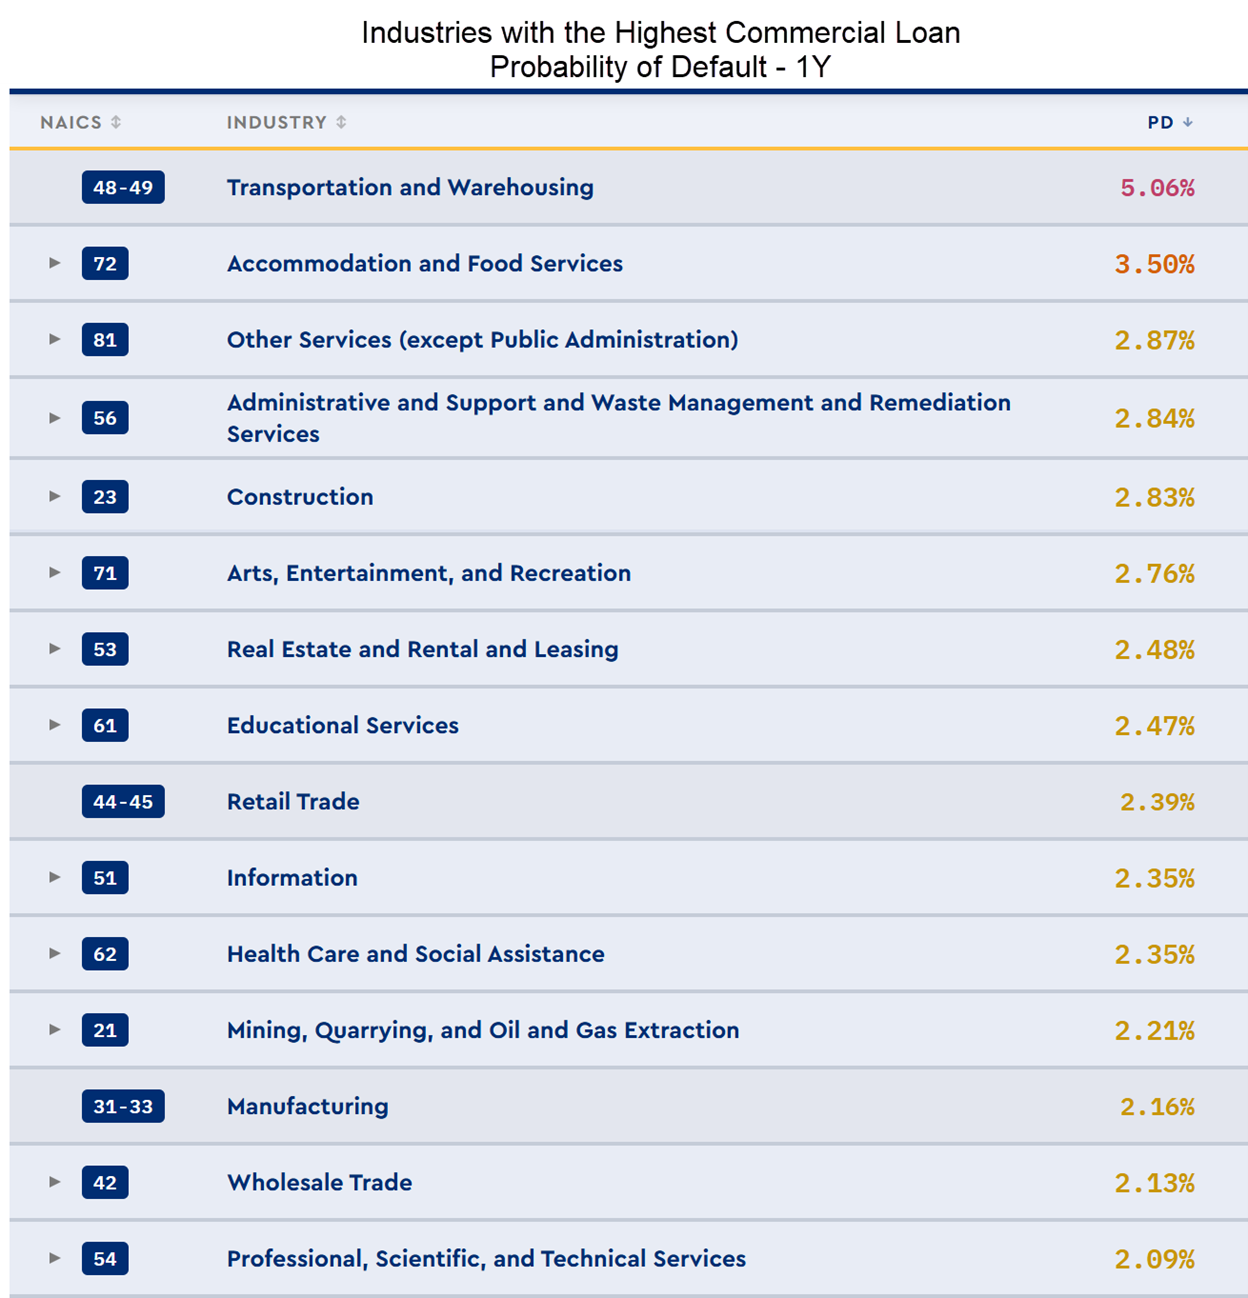
We provide our analysis of some selected industries below.
Agriculture: PODs increased 5% to 10%. While the probabilities of default are still relatively low, it has had the largest increase in risk from the start of the year. This sector is one of the clearest losers from the current setup. Fuel raises planting, harvesting, irrigation, drying, and transport costs. Fertilizer inflation hits corn and wheat economics especially hard, and acreage shifts have started to occur away from heavy fertilizer crops. That creates a squeeze where borrowers may face higher cash operating expense before harvest cash receipts improve, which can worsen seasonal borrowing needs and reduce repayment flexibility on operating lines and term debt. Livestock is mixed: higher feed and transport costs hurt, but grain shifts and weaker corn economics can eventually help feed users relative to crop farmers. Forestry and logging face diesel/logistics stress. Repayment risk rises most for highly leveraged row-crop operators with thin liquidity and rented land.
Transportation: PODs increased 5% to 10%+. Freight, transportation, and courier services dramatically increased risk. This sector was one of the riskiest in community banking and moved higher with the economic stress. Contracts are the key here. Long-term fixed rate contracts when fuel prices are variable is causing a current round of loan modifications.
Manufacturing: This is the most common credit exposure for community banks outside of direct real estate and now has the widest dispersion of credit. Lending to a manufacturing company is best done with a risk-adjusted pricing model and a keen eye to underwriting.
Here are the top subsectors with the highest increase in PODs:
- Food manufacturing with thin margins
- Paper, glass, cement, lime, gypsum
- Primary metals and foundries
- Fabricated metals
- Transportation equipment suppliers
- Plastics users and packaging converters
- Textiles/apparel/furniture with weak pricing power
Here are the sectors with a decrease in risk and some of the lowest net decreases in credit risk:
- Petroleum and coal products
- Basic chemicals tied to advantaged U.S. gas feedstocks
- Pesticide/fertilizer producers
- Some HVAC and industrial machinery tied to capex replacement.
- Select aerospace/defense suppliers.
Energy-intensive process manufacturers are getting squeezed by fuel, electricity, natural gas, and freight. Petrochemical-based inputs also rise. Within chemicals and plastics, some producers benefit from domestic feedstock advantage even as downstream users absorb higher resin costs. Manufacturers that can reprice quickly or have indexed contracts will fare much better than component suppliers locked into annual pricing. Over the next 18 months, the riskiest names are small and mid-size manufacturers with customer concentration, fixed-price contracts, and weak cash buffers.
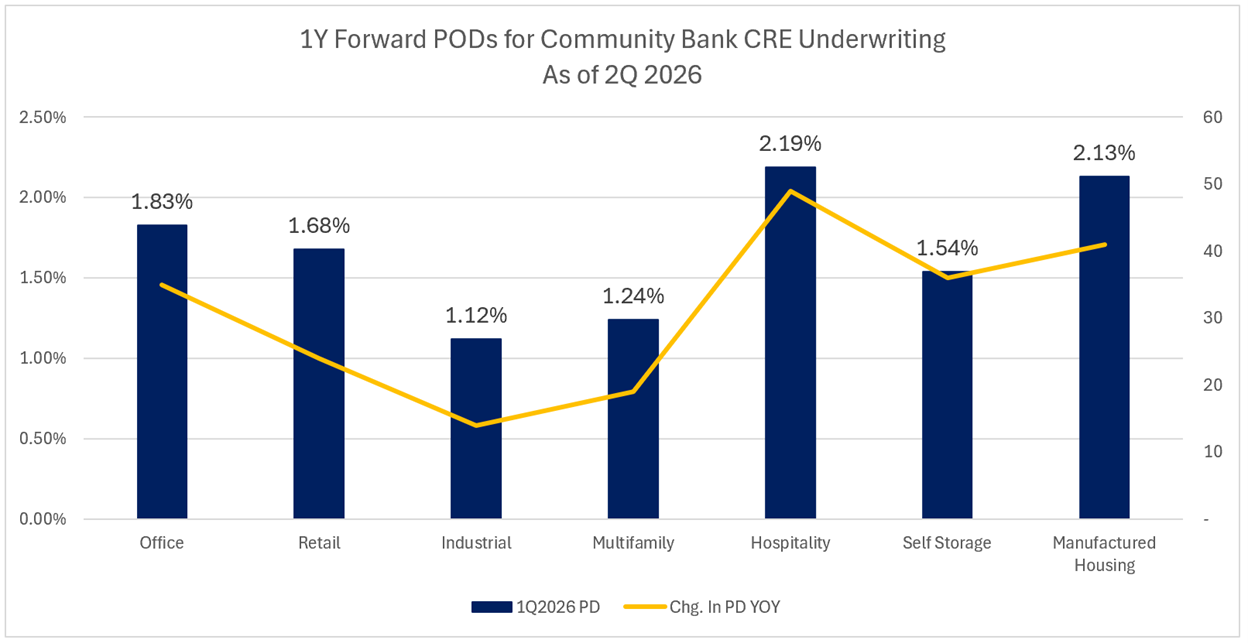
Commercial Credit Trends – Investor Real Estate
For investor owned commercial real estate, the bank credit outlook is more favorable. Most real estate sectors decreased in risk due to tighter supply. Higher post-pandemic rates combined with recent uncertainty has slowed new construction on top of the systemic pandemic rest.
Office: The Office sector is a prime example. While this sector remains of considerable concern, the lack of supply and steady absorption have helped economics for many bank loans. The probability of default has dropped from an average of 2.15% last year to 1.83% looking forward from 2Q.
A swift resolution to the Iran conflict and AI-driven productivity could strengthen the tech labor market and reduce office vacancy by an estimated 25 basis points, despite limited population growth. Conversely, if AI falls short of expectations, a broader market correction could drive vacancy up by about 75 basis points.
Looking at cell phone data, foot traffic continues to increase, and we predict lease rate square footages of peak days which is usually Tuesday. While office buildings are still undergoing a net operating income (NOI) reset, the peak exposure for community banks has passed, and while still elevated, should continue to improve with a conversion to the mean predicted by 2030.
Construction: PODs are elevated 5% to 8%. Construction gets hit from several angles at once: diesel, asphalt, cement, metals, and financing costs. Inflation also tends to keep rates higher for longer, which pressures housing affordability and speculative development. Contractors with fixed-price backlogs are especially vulnerable because input costs reprice faster than revenues. Heavy/civil firms with escalation clauses or public contracts are better positioned; residential and smaller subcontractors are worse. Debt repayment risk rises where backlog quality is weak, working capital is thin, and owners cannot push through change orders.
Multifamily: After last year’s deterioration caused by increased supply, the latest preliminary Costar Q1 multifamily data suggests fundamentals are stabilizing. National vacancy rates rose to 8.54%, up 5bps from Q4 2025. Year-over-year asking rent growth was minimal at 0.2% (down from 0.4% in Q4), while effective rent declines improved marginally, falling by only 0.07%. Q1 2026 absorption was about 81k units—lower than Q1 2025 (124k units), but higher than Q1 2023 (69k) and close to the pre-COVID Q1 average (~93k units). Construction deliveries continued to decrease, moving the market closer to equilibrium.
Retail: Retail rents grew at their slowest rate since 2014 in the first quarter, as the market returns to balance after several years of rapid increases. Nationally, retail rents rose just 1.9% over the past year, marking the first time growth fell below 2% since early 2014. With balanced supply and demand, rising vacancies and slower tenant sales have limited landlords’ ability to raise rents as quickly as they did after the pandemic. One interesting trend has been the conversion of all or part of regional malls into pickleball clubs.
Industrial: PODs remain low for bank credit. Logistics property leasing has returned to pre-pandemic levels overall, though demand varies by building size. Lease transactions over 1,000 square feet are slightly below the 2015–2019 average, indicating normalized activity. Small-bay tenants (1,000–10,000 sq ft) drive over half the leases and remain resilient, at just 9% below peak since 2015. Larger leases (50,000+ sq ft) are less common but gaining stability; transactions between 50,000 and 100,000 sq ft are 10% above pre-pandemic averages, while those over 100,000 sq ft are about 25% higher than 2015–2019 levels.
Hospitality: U.S. hotels sold more rooms in the first quarter of 2026 than any previous Q1 since 1987. The increase of 5.9 million rooms year over year led to a 3.6% rise in RevPAR, marking the strongest quarterly growth since late 2024. Look for growth to slow due to inflation-impacted lower business and leisure travel. This volatile sector may be the second sector to undergo a credit shock behind construction causing banks some issues. Pricing as increased in 1Q, so we view the sector as fairly priced.
Credit Trend Ramifications & Loan Pricing
If you use Loan Command, our relationship profitability tool available to any financial institution for $89/month/person, you have all this data live to help you with your pricing and credit decision. Credit for hundreds of industries is included, as well as live rates. We have priced this cheaply so any bank, no matter its size, can afford this valuable tool. If you are not a subscriber, ensure your profitability model considers this significant credit increase.
One material ramification of this data is that loan profitability has dropped year over year. The main drivers have been lower credit spreads, lower fixed rates, rising funding costs and higher credit costs. This has served to decrease the risk-adjusted margin. Whereas last year, the average bank loan profitability was just under 18%, the current risk-adjusted return is now just a little over 16% (below).
While this is still in healthy territory for banks, it is essential to point out that under a stressed scenario that includes two standard deviation credit shock, the stressed ROE goes negative (the -4.8% above), meaning many banks will have to eat into capital during the next recession by an average of $59,000 per million.
We point this out as we are currently under more than a 1 standard deviation credit shock and should tariffs, energy pricing and inflation is not resolved in the next year, bank credit risk will be under increasing pressure.
One counterintuitive point that merits contemplation and tactical decisioning is pricing. Typically, pricing needs to increase due to higher credit risk. However, as banks tighten lending, banks have stopped lending to many risky sectors. As a result, banks are going after higher-quality borrowers and existing customers where the credit risk is known and volatility is low. As a result, pricing for quality credits has continued to stay contracted. For credits below a 2.50% POD, commercial loan pricing has gone from an average spread of 2.48% last year to 2.36%.
More to this point, volatility has increased so it is now routine to see credit spreads contract and expand by more than 20 bps in a single week. This aspect of the credit market further plays into the need for banks to utilize a risk-adjusted pricing model.
Putting This Data into Practice
In good times, this data can be ignored. If you are wrong in pricing credit or allocating capital, the impact is likely less than 50 bps of ROE performance. However, when the principal is at risk, being wrong can have terminal consequences.
When borrowers feel stressed, this data is invaluable for pricing, capital, and structuring decisions. The increase in PODs, loss-given defaults, and expected losses mean that banks need to choose their credit and pricing wisely. Getting more granular in credit risk means a more efficient allocation of capital.
Banks are more leveraged than the average hedge fund, and lending decisions have outsized consequences. Equally important, there is a time dimension to credit that is seen in only a few industries. While banks manufacture credit and relationships, it’s not like selling a widget.
You can correct your error the next day if you misprice a widget. When bankers make a credit decision, they live with that credit and that pricing for an average of six years.
To see more of our probabilities of defaults, utilize our interactive widget found HERE:

To get these PODs, loss given defaults, volatility (which no other model tracks) and live interest rates directly into a relationship profitability model, check out Loan Command with its free version.
Also stay tuned for next week as we cover loan pricing given this new data.