
5 Things To Know About Bank Performance for 2Q 2026

With complete call report data now available, the banking industry offers several useful signals that can influence how every bank thinks about positioning and strategy. In this article, we summarize the key trends for bank performance for 2Q 2026 and explain what they mean for management teams that are strategically focused and committed to data-driven decision-making.
The Backdrop for Bank Performance for 2Q 2026
Volatility remained high for the quarter and geopolitical events kept banks, and their clients, guessing market direction. As the Fed removed its forward guidance, it is now harder to ever to plan and mange both interest rate and credit risk.
1-month short-term rates stayed relatively steady at 3.62%, as the Fed kept the Fed Funds target range unchanged at 3.50% to 3.75%.
Interest rates rose and flatten over the course of 2Q putting pressure on interest rate margins and making fixed rate balance sheet loans less attractive. The 2Y Treasury rose 38 basis points for a 3.97% average, while the 10Y Treasury rose 33 basis points over last quarter to average 4.42% and hit a high of 4.71%.
While our full analysis is HERE, this economy produced the high-level bank performance for 2Q 2026 below.
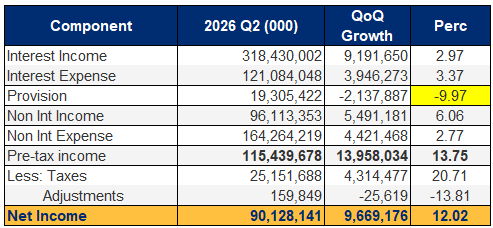
On the surface, all looks good, but let’s look deeper at the numbers to uncover our top five major insights from the quarter.
Insight 1: Deposits Growth Is Hard, But There Is Hope
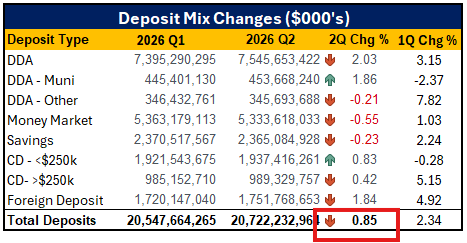
Last quarter, deposits grew at a 2.34% rate. This quarter’s growth slowed to 0.85%. Almost every category but municipal deposits and CDs under $250k had a lower rate of growth.
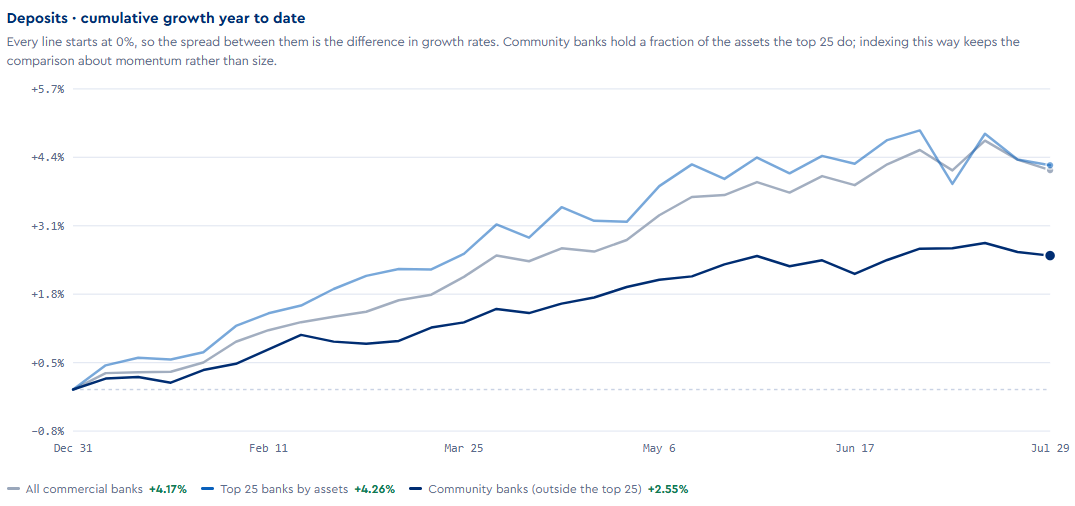
For community banks, it gets worse. While the Top 25 banks grew at a cumulative 4.17% for the year, community banks are only totaling a 2.55% rate. For July, this rate of growth is slowing even more and was -0.13% for the month. The picture gets one more step worse, as the backdrop of M2 money supply has an annualized growth rate of 5.53% and increased yet again by an annualized 5.21%.
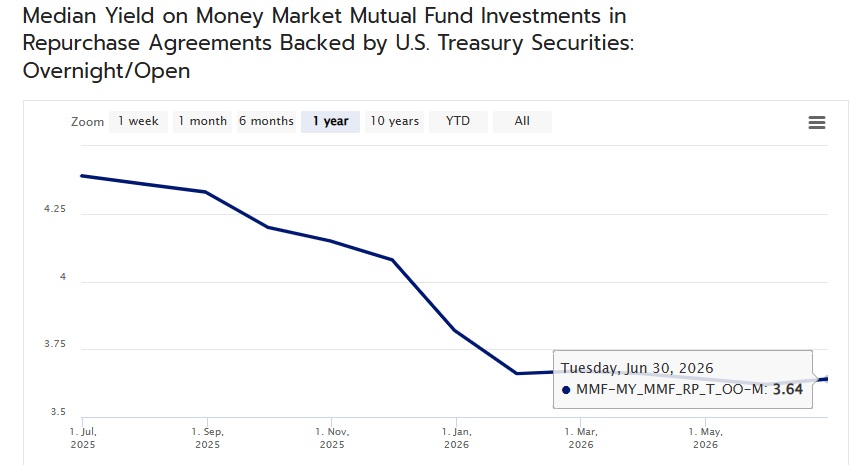
The hope stems around competition from money market mutual funds. Because the Federal Reserve has been uncertain with its rate hikes, money market mutual fund complexes have been reducing duration, and thus lowering yield in the process so that it can outperform their index. What was a 4.25% rate last year that banks competed against is now down to a 3.64% and set to go even lower for the next month before the Fed potentially moves rates up in September. This provides banks one of the best times since 2022 to convince commercial and corporate clients to move from a money market fund into a bank money market or savings account.
Insight 2: Self-Pressure – Loans Grew at 2x Deposits
If competitive and environmental pressures were not enough, banks felt it necessary in 2Q to double down on the deposit headwinds.
Not only are deposits slowing, but with deposit growth of only 0.85% last quarter, banks put more funding pressure on themselves by growing loans at 1.81%. Banks were able to get higher loan yields last quarter, as interest revenue went up 2.7%. However, interest expense rose 3.4%.
Loans-to-Deposits went over 81% last quarter, the highest level since early in the Pandemic.
This is classic late cycle behavior as banks reach for performance and sacrifice balance sheet mix. This is to say that banks have to work harder to keep up with PPNR earnings growth. For example, not only did banks take on more interest rate risk last quarter, but they also hurt liquidity. Non-core funding grew at 11%, while brokered CDs rose 5 bps to hit a 5.92% ratio to total deposits. Loans-to-deposits moved up from 65.6% to 66.2%, highlighting this pressure.
The irony here is that while banks tell their team they are focused on net interest margins, they are really relying more and more on balance sheet changes to drive profit. This can only last so long before you sacrifice risk beyond what you can control. These balance sheet changes that are slowly happening will make it increasingly difficult to drive future profitability. Deposit strategy has to become a centrally competitive battleground for banks.
Insight 3: Capital Formation Is a Speed Limit
All this loan and deposit growth has started to pressure capital ratios as Tier 1 leverage capital fell below banking’s five-year average and is the lowest ratio since 4Q 2022, the end of the Pandemic Era when quantitative tightening started.
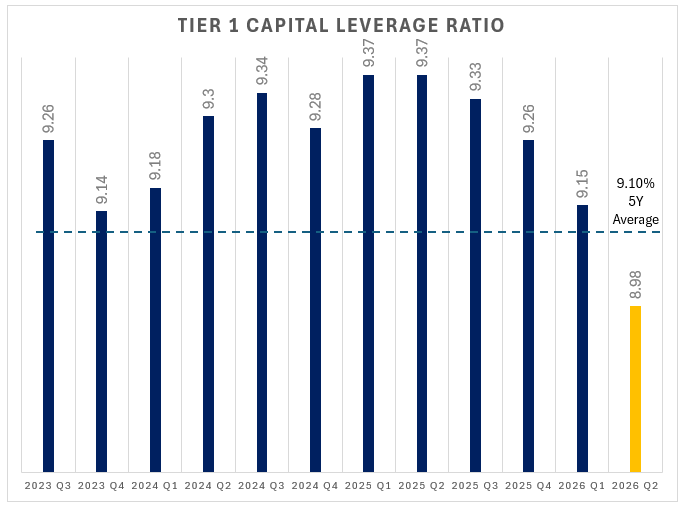
On the surface, this is understandable and only means that banks grew faster than their capital base. However, there is a second order issue here.
Not only does this mean that growth is outstripping capital formation, but it also means this is happening at the same time banks are taking on more interest rates and credit risk. Declining capital places another constraint exacerbating the risk profile of the average bank.
The solution? This means banks not only need to place more emphasis on deposit management, but on loan profitability and the generation of non-interest income growth. Banks also need to control their earnings payout and dividends.
Capital formation has a speed limit on how fast banks can grow. If a bank wants to grow at 10% and wants to payout 35% of earnings to its shareholders, it essentially needs to produce better than an approximate 1.40% ROA to generate enough capital to continue to grow.
Because of leverage, this is a geometric equation for banks. A 1.40% ROA bank can support nearly 75% organic growth than a 0.80% ROA bank assuming the same leverage a dividend policy.
The key understanding here is that banks don’t want to maximize asset growth. They want to maximize capital-efficient product and customer profitability.
Insight 4: Credit Needs Vigilance
While total delinquencies fell from 1.53% of total loans to 1.44% (below), credit monitoring should remain elevated.
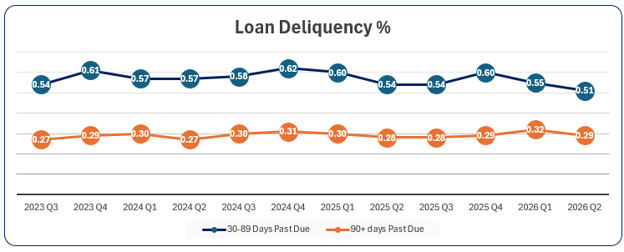
Problems increased for junior lien residential loans and commercial/land construction (below). In both these cases, banks are cautioned to monitor their underwriting.
Further, While CRE owner occupied loans finally abated their march up in delinquencies, non-owner occupied non-performing loans fell, underscoring our point last quarter that banks need to get more granular in their pricing and careful in their loan structuring. At issue here are banks that shift the interest rate risk burden on to their customers.
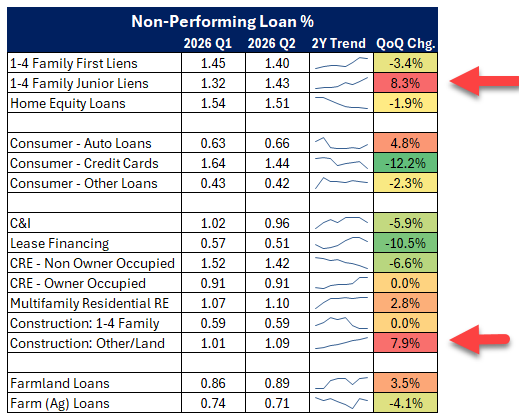
The above issues get exacerbated driven by growth. Some of the highest delinquency areas are also areas where banks are growing the most (below). Keep in mind that this is against a backdrop of falling allowance for loan losses (ALLL). ALLL dropped from 1.64% of total loans to 1.61%.
Banks with our Loan Command pricing model get the latest forward-looking probabilities of defaults and loss given defaults integrated into their relationship pricing, however, if you don’t have a dynamic risk-adjusted pricing model, our latest probabilities of default can be found HERE for reference. Banks looking for commercial loan pricing references can find our latest 2Q forward-looking credit spreads HERE.
Insight 5: Are Dividends Worth The Investment
The good news is that banks are starting to invest more in artificial intelligence which caused an increase in non-interest expense of $4B for the industry from 2.49% of assets to 2.50% of assets. Banks also reduced their dividend payout from 1Q, but the level remains elevated.
Our point here is that the average total return of bank stocks for 2Q was around 11%. Can bank management not do better than 11% investing in emerging trends such as generative AI, agentic AI, tokenization and digital transformation?
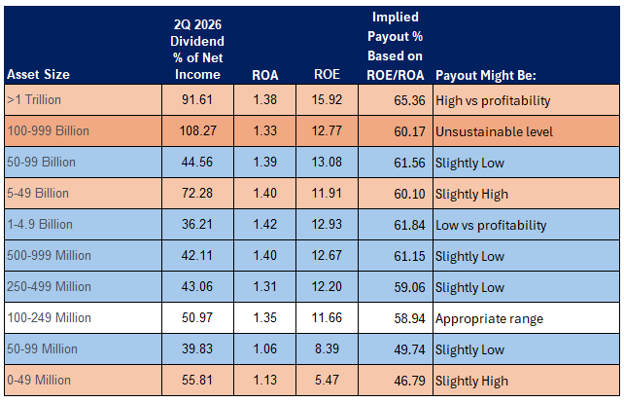
Below we broke down banks, by asset size and looked at their 2Q dividend payout against their financial performance and asked the question – is their payout correct. In many cases, the answer was yes. These banks, in blue, have low payout compared to the market but that may mean they either have more risk to guard against or better investment opportunities within the bank such as AI. The banks in red, however, are likely paying out too much given their performance and other options.
Dividend payout needs to be judged on a case-by-case basis for every bank. However, we suspect that too many banks are not thinking long term and comparing their current dividend payout today vs. what other opportunities they have.
Putting These Insights Into Action
The action steps from bank performance for 2Q 2026 are clear: banks should make deposit acquisition and retention a primary strategic priority, slow or reprice loan growth where funding and capital are constrained, and shift focus toward capital-efficient customer and product profitability.
Management teams should also maintain heightened credit vigilance, use forward-looking risk-adjusted pricing, and reassess dividend payouts against the return available from reinvestment in AI, digital transformation, tokenization, and other productivity-enhancing initiatives. In short, the banks that outperform from here will be those that protect liquidity, preserve capital, price risk precisely, and invest aggressively in the capabilities that improve future earnings power.
Want to explore more Bank Performance for 2Q 2026 trends? Click below to our 2Q Industry Assessment Tool powered by Amberoon.