Managing Loan Life to Manage Bank Performance

In previous articles (here and here), we discussed how a portfolio of commercial loans with various expected average lives results in different net present value (NPV) of income and return over a ten-year period. We also identified ten variables that are responsible for extending the average expected life of a commercial loan. As we continue with a focus on managing loan life, we would like to demonstrate how the average expected life of a loan portfolio affects the efficiency ratio and competitive pressure for a bank by reviewing a specific example of two identical portfolios but with different average expected lives.
Managing Loan Life – Portfolio Comparisons
Assume two community banks with identical $1Bn commercial loan portfolios (same credit quality, overhead and maintenance costs, etc.) with only one material difference – one portfolio is comprised of loans with an average life of 7 years and one with 2.3 years. Let’s assume that each bank would like to grow its loan balance by 5% in a year (a reasonable target). Our analysis is demonstrated graphically below and further discussion follows.
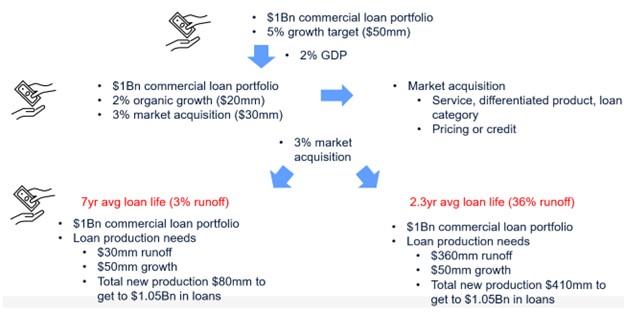
First, 5% growth on a $1Bn portfolio translates into $50mm in additional loan balances, and we assume 2% GDP growth. That means that of the 5% loan growth target, 2% will be organic growth (let us relax the inflation adjustment differences on GDP and nominal loan growth). Therefore, 3% of the loan growth must be business acquired from other financial institutions. Despite the arguments of better service, differentiated products, or ability to lend on broader loan categories, the reality is that loans are won from other institutions on pricing or structure (neither a long-term desirable outcome for the winning bank).
Now, let us consider the scenario for the bank on the left in the graphic above. A seven-year average loan life means a 3% loan run off per average year. This bank must replace $30mm in loan prepays and add another $50mm in loan growth for a total of $80mm in new loan bookings. Of the $80mm in new loan bookings, $20mm is organic growth from market expansion and $60mm from other banks through intense competition.
The bank on the right side of the graphic above has an average loan life of 2.3 years and that translates to a 36% run off per average year. This bank must replace $360mm in loan prepays and add another $50mm in loan growth for a total of $410mm in new loan bookings. Of the $410mm in new loan bookings, $20mm is organic growth from market expansion and $390mm from other banks through intense competition.
The bank on the right side of the graphic has a much harder job to maintain its growth targets. Not only will this bank require more lenders, underwriters, and loan processors to retain and grow its loan base, but those same loans will more likely be thinner priced because a larger portion of new bookings were originated in competition with incumbent lenders. This bank will necessarily demonstrate a higher efficiency ratio for the same growth rate.
Focusing on Product
Most banks have some ability to construct their loan portfolio with various expected average loan lives. For example, some loan categories have shorter expected lives: construction loans, stabilization loans, tenant improvement loans, substandard credit loans (because if the loan quality improves the loan tends to prepay), and lines of credit used to finance longer-term assets. Further, loans with low switching costs (weak or non-existent prepayment provisions) provide the borrower a free option to refinance – again leading to shorter expected average lives.
Shorter expected life on loans decreases profitability because commercial loans have thin profit margins after accounting for ongoing costs such as COF, credit charges, and loan maintenance costs, and those loans have high upfront origination costs. Without the time necessary to recognize that thin margin or having to compete for new loans to replace loans that prepay, a bank cannot recoup its cost of originating the credit. It is with long and stable periods of earned margin does the commercial loan becomes profitable and efficiency ratio can decrease. Losing existing loans is expensive because replacement must occur through competition with incumbent lenders.
Community bankers must strive to increase expected life of their commercial loan portfolios to increase profitability. Most loans can be made more profitable with a longer stream of income. Unfortunately, most loan pricing models do not track, predict, or measure expected loan lives, and some community bankers do not measure historical loan lives and do not factor this important variable in their loan pricing decisions.
Conclusion
Managing loan life to improve bank profitability is an underappreciated skill. The next time you compete for a commercial loan, and find that the margin, the fee income, or cross-sell opportunities are not attractive, consider the expected life of that loan. What may appear to be a thinly priced credit, may be the correct market clearing price for a long-term, stable, earning asset with a strong prepayment provision that translates to a longer expected loan life and higher profitability.