Branch Profitability in 7 Steps Using Data

While the branch still has its place in banking, it has radically changed since the pandemic. Branch profitability is now harder than ever to achieve. Driven by changing traffic patterns (data HERE), we talked about how these changes permanently altered branch strategy HERE and gave readers five new tactics HERE. In the past, we also talked about what machine learning has taught us about branch management (HERE). Today, we highlight seven marketing tactics, driven by data, that can make any branch more profitable.
Step 1: Start with Potential Branch Profitability
Let’s take any given market for analysis. In this case, we chose Huntsville metropolitan statistical area (MSA), a market with $11.4B of available deposits (per FDIC), 4.4% loan growth (FDIC), 2% population growth, 2% capital investment growth, above-average income, and 3.1% unemployment (all per Chamber of Commerce and datausa). In short, it’s an idyllic spot for a profitable branch. Yet, despite the strong economic background, of the 117 branches in the area, approximately 31 are unprofitable and 31 are around breakeven profitability. Now, while estimating another bank’s branch profitability is an inexact science you can get in the right ballpark.
At a 9% cost of capital and Huntsville’s cost structure, a bank would need a branch with some combination of $60M in loans, $50M of deposits, and about 12% or more of revenues coming from fee income. More than half the branches in the market fall short of that and suffer from a suboptimal combination of volume, product mix, and a customer lifetime value that is far too short.
Of course, as we have mentioned before, you never want to make decisions based on current branch profitability but potential profitability. That is, even if you have an underperforming branch, it might be a result of age, personnel, product mix, marketing, or a combination of all. To help inform our decision, we can produce a branch performance index for the market (below) that shows approximately how a bank performs in each area.
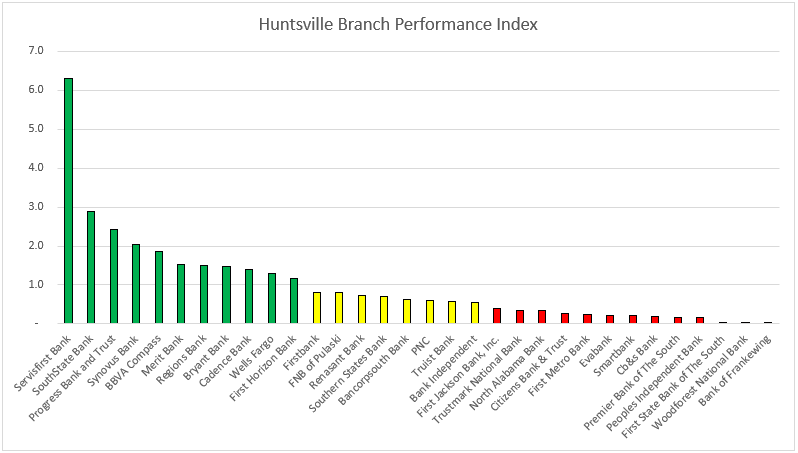
Here, you can see, the banks in green hit above their weight (branch age, size, etc.) and have outsized profitability. Servisfirst is a clear winner in this market and while it could be for any number of uncontrollable factors such as branch location or accounting anomalies (such as booking out-of-area loans to a specific branch) usually superior branch performance comes down to four specific items, in order:
- Personnel
- Product mix and structure
- Customer engagement & satisfaction
- Marketing
Step 2: Get the Right Mindset – Market Locally
When we say “personnel” makes a branch, what we really mean are bankers that are good at mustering resources to focus on making the customer happy and acquiring new customers. Selling more profitable products to more profitable customers is hand-to-hand combat and first and foremost a bank needs to understand this “last mile of sales and marketing.”
If your bank is using centralized marketing campaigns that don’t take advantage of customer data and personalization, then it’s highly likely your bank can get a huge response and conversion lift by using these tactics to help grow your branches profitably.
Step 3: Competitor Analysis – Copy What Your Best Competitors Are Doing
It would be shortsighted to ignore your competitors since they can point a path to what to do or not to do. Further, if you are going to grow your branch above the average, you will need to steal customers from somewhere, so it helps to know the competition.
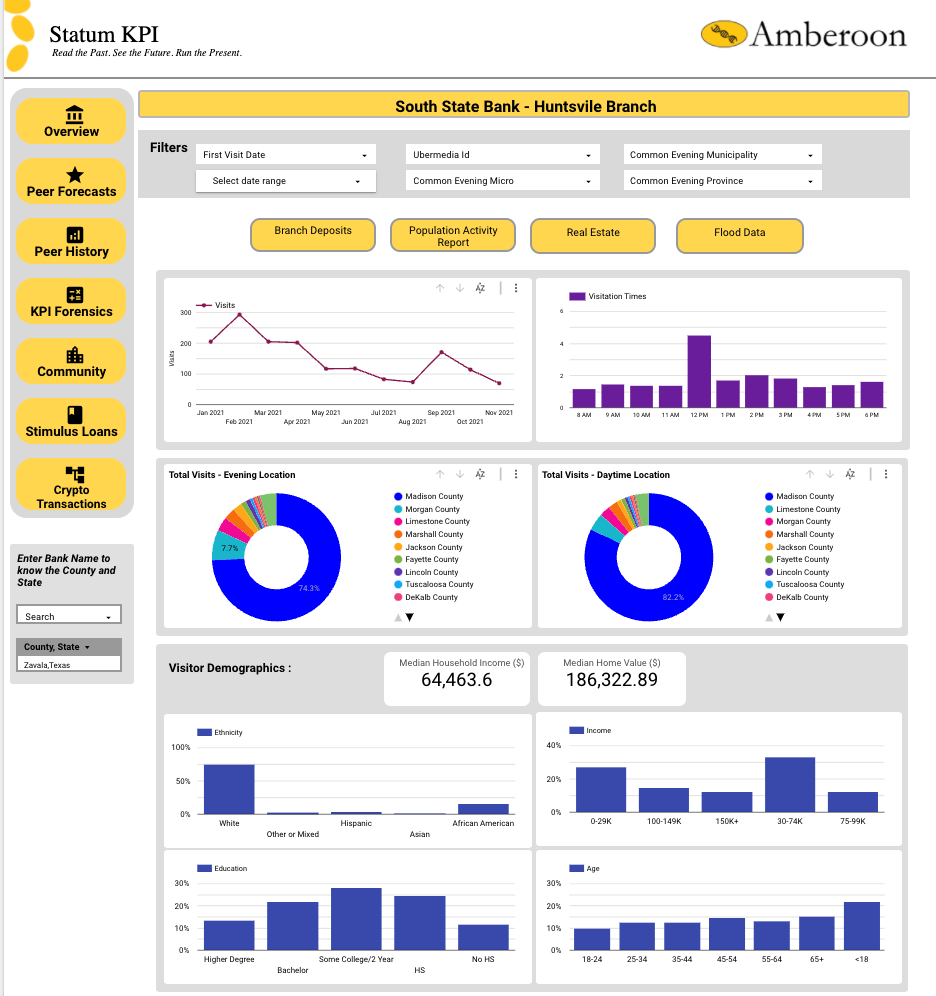
Here, we can use a tool like Amberoon’s Statum KPI product that is worth its weight in gold. Here, we can drill down to the individual customer level of our competitors. While we can see all sorts of Call Report, census track information, real estate holding/trends generated data, what we really like about this tool is the cell phone tracking data.
Here we can see individual customer visits. More importantly, we can see data on those customers before and after the visit. As to not to get too creepy, we will use our own branch, but this could be data on any bank, financial institution, or potential customer with a brand affiliation that we want to acquire (more on this later). Below, for example, you can see our dropping branch traffic (like most banks), our visitation hours (lunch-time centric customers), where they come from, and where they go at night.
Step 4: Product Mix and Product Structure – The Critical Element to Branch Profitability
It’s no surprise that market leaders become market leaders by providing products that help increase satisfaction, engagement, and profitability. When you look at why Servis1st does so well in the Huntsville market outside of their personnel, it is because they focus on a variety of profitable products that support engagement and low-cost acquisition. They like focusing on longer-term commercial lending relationships, treasury management, credit cards, mortgage lending, and private banking. While that mix isn’t for everyone, it fits very nicely into the Huntsville market.
Any bank can alter its marketing allocation to support those products or figure out a way to develop or partner to provide their marketplace with these and other profitable products.
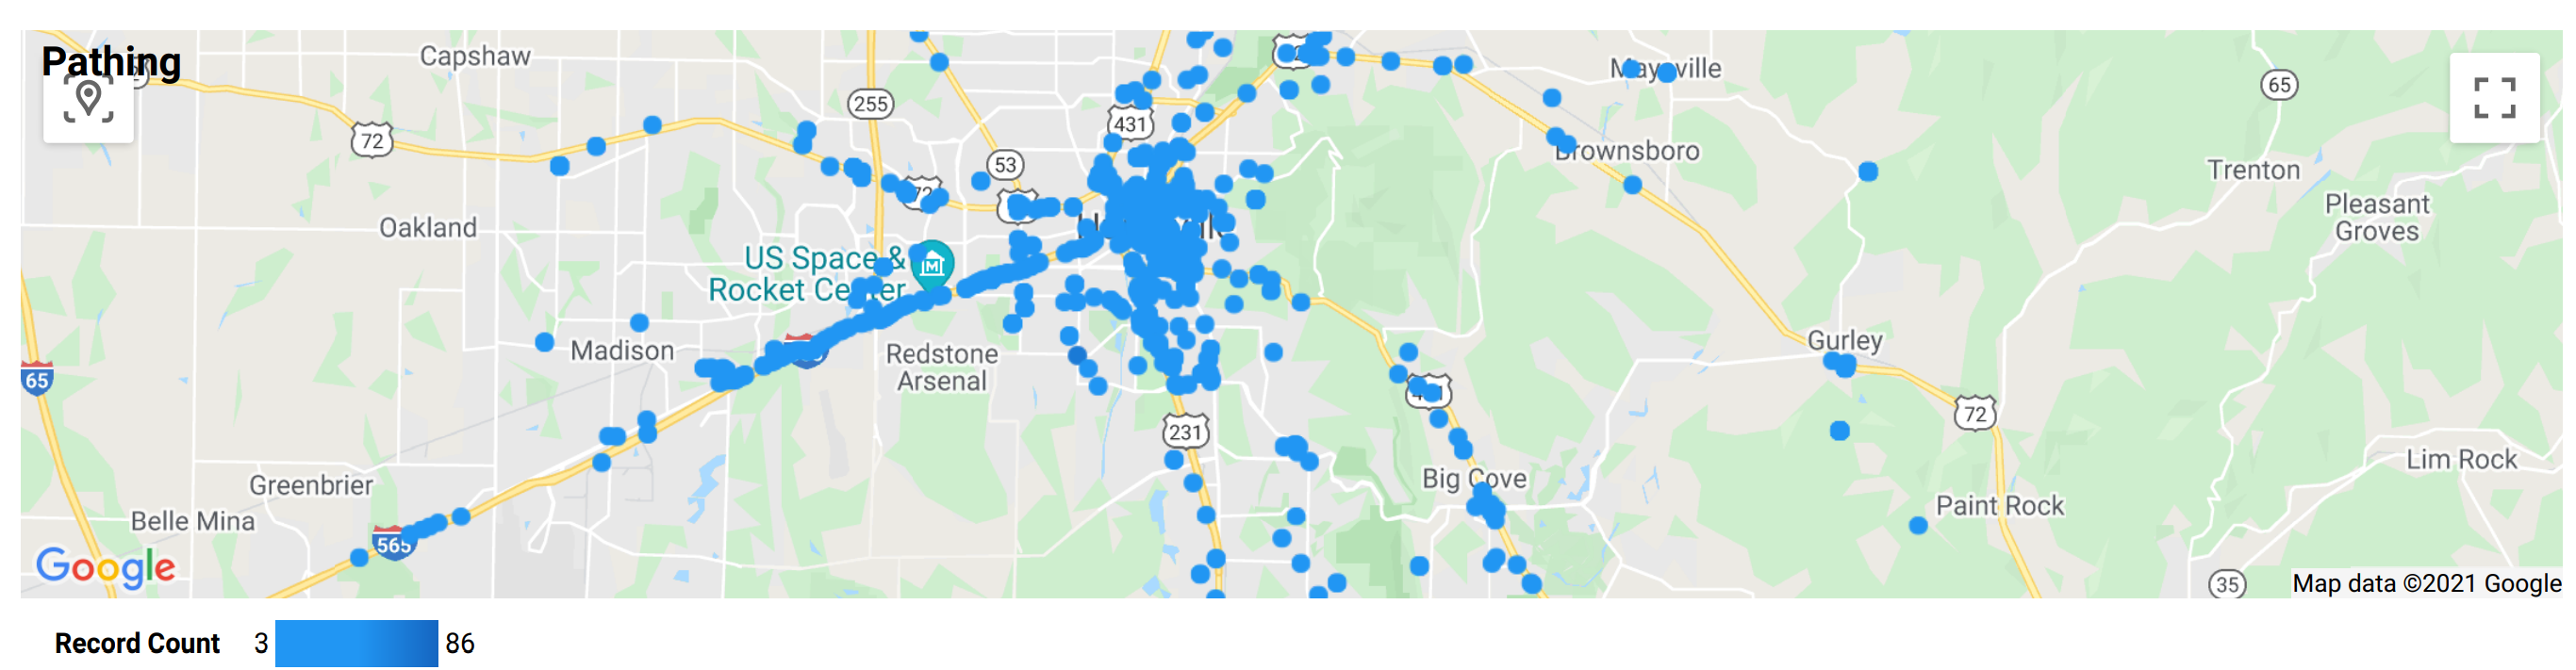
Step 5: Using Pathing Data – Jump Ahead of Your Competitors Through Better Marketing
This is where the use of data gets hyper-powerful. Using Amberoon’s cell phone traffic data, you can see where all of your customers entered your branch (or your competitor’s branch) 30 minutes before they entered. This is called “pathing data.” We can take this data and classify it to find out how many are at work, their homes, common shopping areas, gyms, or other locations. This gives us deep insight into our customers and now allows us to tailor staffing, marketing campaigns, and promotions to specific customer types.
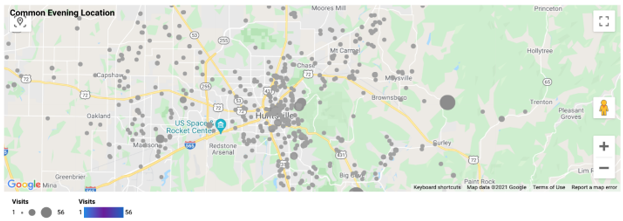
Step 6: Using Destination Data – The Killer App for Branch Profitability
This is the killer application step – By knowing where a customer or potential customer’s cell phone location stabilizes at night, called “destination data,” we can surmise where these users live. By cross-referencing this information with your core system/data warehouse or by using third-party address data, we can now stitch together a full identity.
Let’s stop and consider the power of all this data at your fingertips. You can now have access to the same data that Google and Apple have, and you can use it to be more relevant to your customers and prospects. You now know where your customers start their day, end their day, and where they are right before they decide to walk into your branch.
Further, you can pick out any location and find out the traffic data around that location.
Step 7: Marketing Using This Data
Using footfall cell phone data now gives you a rich treasure trove of data to drive branch profitability, the effectiveness of which is limited only by your creativity. Here are but a few examples of tactics that can be driven from this data:
Branch Optimization: For starters, by understanding the traffic flow of your customers, you can better optimize your branch hours, staffing, and interactive teller placement. If you have multiple branches in the area, you might want to suggest moving a customer’s account to another branch that might save them time.
Competitor Marketing: Find out details about your competition’s customers and market to them with a special promotion to get them to switch. For example, you might find that employees from a certain manufacturer or company go to a competitor during their lunch break, but your branch might be closer or have better hours.
Brand Affiliation Cross-Marketing: In the past, we have discussed how the affiliation of certain brands statistically results in greater bank conversions because the users of those brands tend to care more about banking. For example, Home Depot and BMW customers are more likely to open an email and convert about a new loan or deposit pitch. You can draw a polygon on the map around these locations and have a great list of leads to market your products and services.
Event Marketing: Banks like Amex and Chase do a great job at event promotions using this type of data. By knowing your customers that attend recurring farmer’s markets, concerts, and other community events, your bank can offer VIP access, discounts, viewing areas, or other cross-promotions to not only make your customers feel special but as a customer acquisition tool.
Channel Management: Understanding this footfall data can also help your bank better manage banking channels. The notion that you want to bank your customers where they want to bank is extremely misguided as it assumes your bank is a passive participant. Successful banks do the opposite and proactively help customers choose the best channel for them. This may require education and having this data and help inform your bank of who might benefit the most from various channels.
As an example, banks can now leverage the data discussed today and have a more effective branch consolidation plan or better target those customers that are not taking advantage of mobile banking.
Pathing Promotions: Knowing where your customers are coming from is potent. As you can see above in our data, our lunch traffic counts skyrockets, and we can see from the pathing data that many of these customers come from work. We can further delve down and see what customers are coming on their lunch hour to handle personal banking, which are handling their merchant banking, and which are handling both.
Banks with a merchant concentration around certain times may want to consider pre-staging transactions in merchant lockers to help decrease wait times and increase lunch hour throughput.
We might want to partner with a lunch provider to have a “grab-and-go meal” ready at the branch to save our customers time or consider holding special events such as a parking lot BBQ or “Come by a grab a bowl of Grandma’s Famous Stew” catered promotion.
Pathing data can also help inform partnership ideas with universities, restaurants, country clubs, fitness centers, CPAs, or other frequented brands within the community.
Putting This Into Action
As we have discussed in this article, highly personalized data about your customers and prospects is now easy to obtain. Banks need to move away from mass marketing and leverage this data to become hyper-personalized to make branches more profitable.
Knowing the traffic patterns of your customers and potential customers in the form of “look-alike” targets allows you to execute a variety of marketing tactics such as more effective partnerships, location promotions, brand affiliation promotions, lifestyle selling, or event marketing. This data allows you to customize your marketing message to the individual customer level to become more relevant.
In the process, banks can leverage these tactics to optimize their personnel, branch layout, product mix, product structure, branch staffing, and hours.
Branch profitability is not a passive exercise. The difference between a below-average branch and an above-average branch is the amount of energy and resources devoted to profitably growing a branch.
It is likely your competitors are either doing either very little branch marketing, are not scaling their personalized marketing efforts, or are still using antiquated demographic targeting. By following these seven steps, you can make your branches ultra-effective at localized marketing while making your branches more efficient.