The Potential Value of Hedge Fee Income

Community banks have historically generated less non-interest or fee income than larger lenders. One reason for this is the lack of analytics on how fee income translates to revenue and profitability. While there are many ways that community banks can increase fee income, one specific source of non-interest income should be particularly appealing to community banks in today’s challenging interest rate environment and competitive loan market. We ran the analysis for community banks based on various loan terms, prepayment speeds, and hedge fee income potential and created a conversion mechanism allowing bankers to quantify fee income and net interest margin (NIM) -equivalent performance measurements.
Industry Comparison
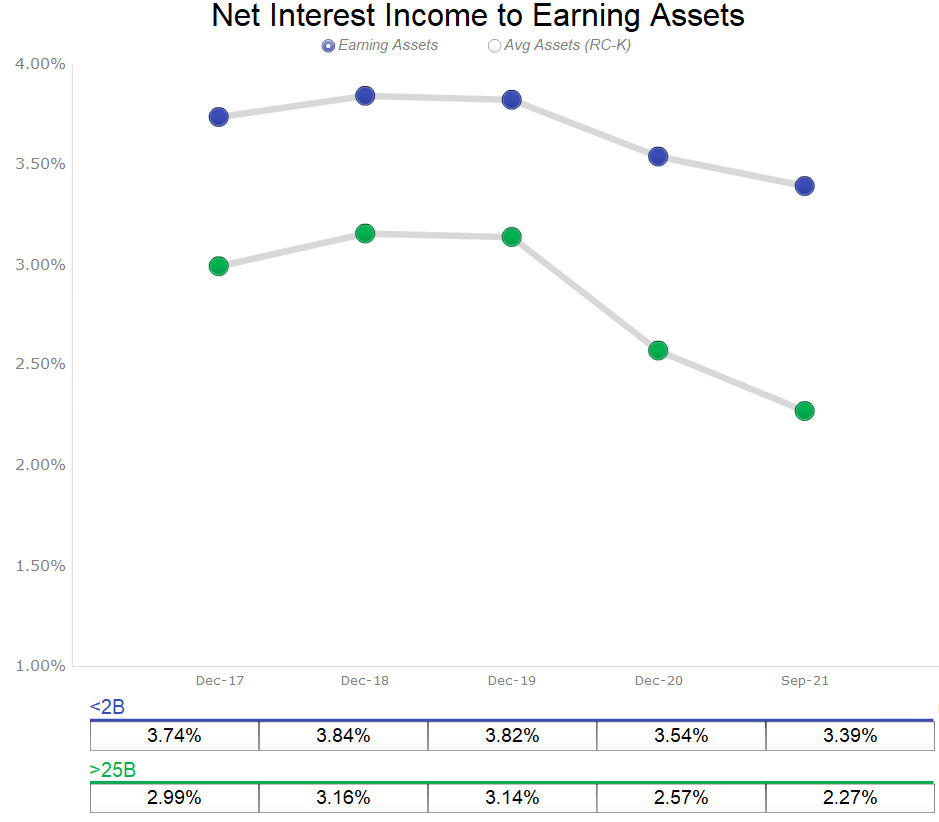
Larger banks have historically operated on thinner NIM. The graph below compares NIM from 2017 to Q3/21 for banks over $25B (83 largest banks) and under $2B (4,086 community banks). NIM for the entire industry is under pressure, but larger banks generate substantially less NIM.
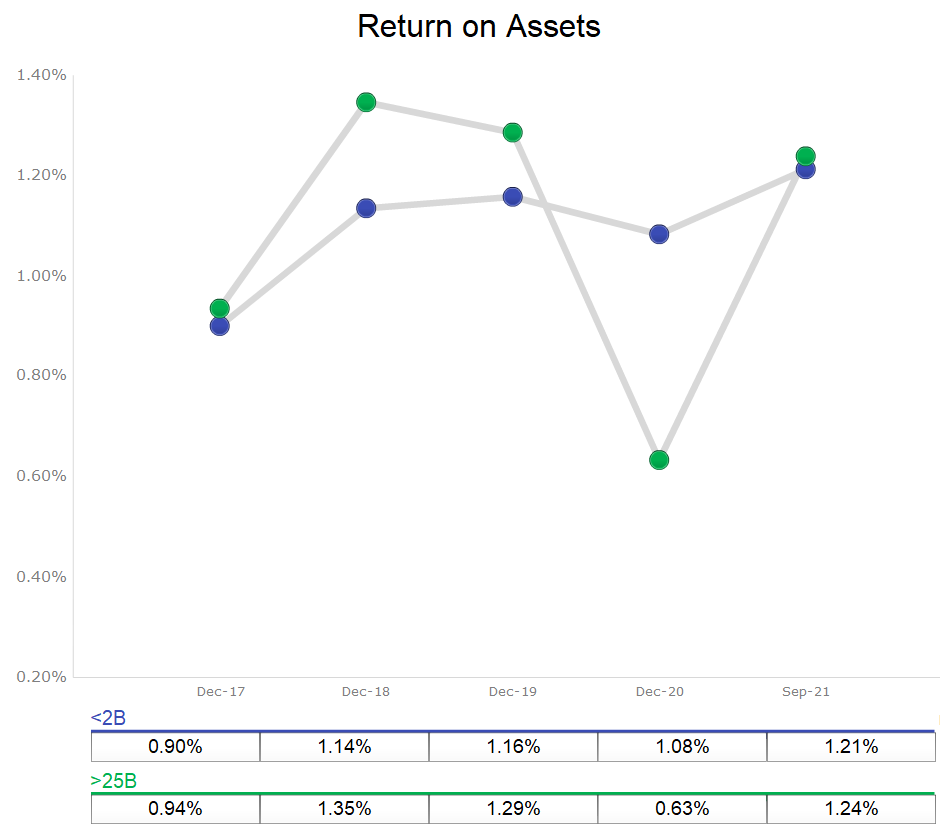
For these two groups of banks, the ROA is relatively close, with larger banks generating slightly higher ROA over the same period (except for 2020, largely because of the pandemic and credit reserves), as shown in the graph below.
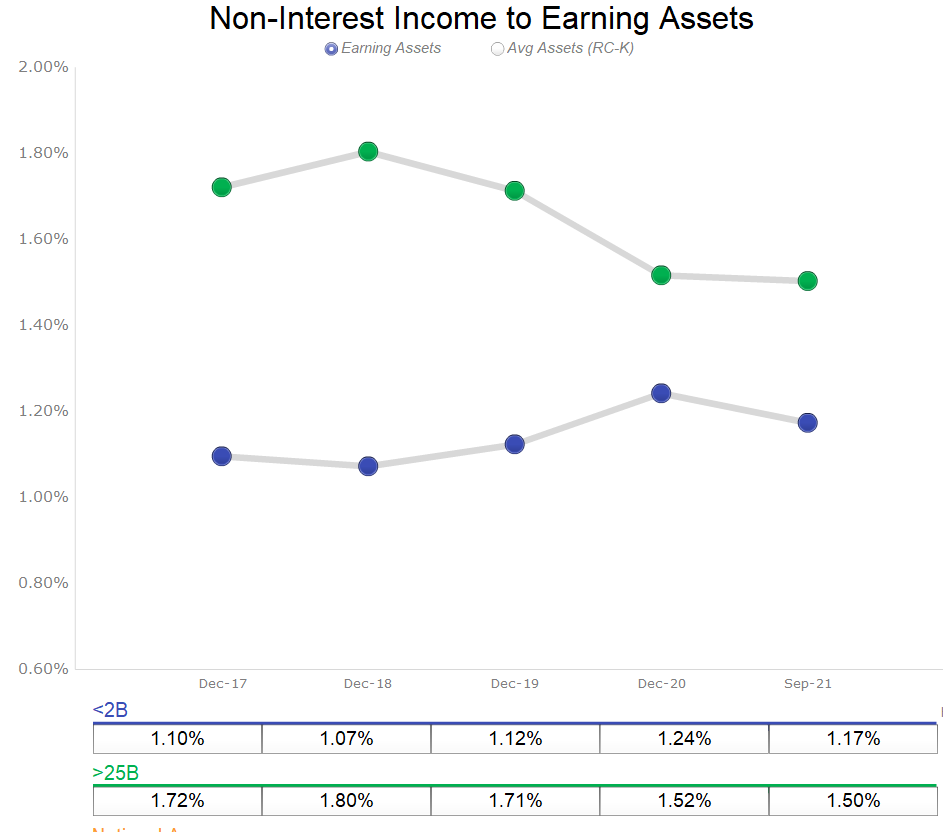
There are myriad reasons why larger banks can generate similar or higher ROAs than community banks with lower NIM. However, one reason stands out and is shown in the graph below – non-interest or fee income.
While community banks were able to increase fee income in 2020 and partially through 2021 because of PPP loans, this source of income is unlikely to be replicated in the future. One readily available source of fee income for community banks is hedge fee income on commercial loans. However, many bankers cannot quantify the value of commercial fee income on their bank’s performance.
Why Hedge Fee Income Is Important
Hedge fee income on commercial loans is very powerful because it magnifies the value of the fee over the life of the loan. The hedge fee is the cumulative sum of a spread on a loan and is paid in a lump sum and may be recognized by the bank upfront. The hedge fee can vary from 50bps to about 3% of the loan amount, depending on the term, amortization, and market competition. The table below shows loan terms in the first column, hedge fee as a percentage of the loan that community banks can generate in today’s market in the second column, and that same fee amortized over the contractual term of the loan in the third column.
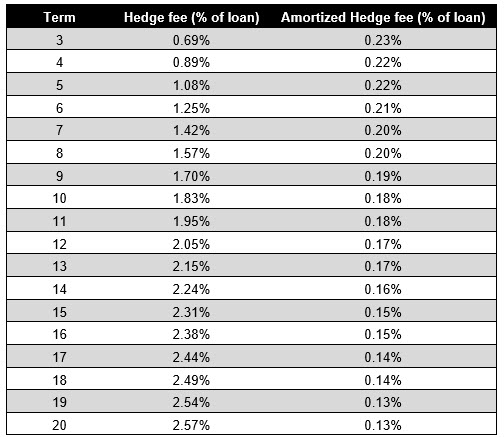
While the hedge fee can be a substantial percentage of the loan amount and recognized immediately in income, many bankers erroneously amortize the fee over the contractual life of the loan to calculate the income boost or NIM-equivalent revenue. This amortization of the fee over the term of the loan is a quick way to convert the fee income to NIM-equivalent revenue; however, it is not mathematically or economically correct for a number of reasons.
The argument for dividing the fee by the contractual loan term goes something like this: hedge fee income is just a substitute for wider margin, and banks may simply choose wider NIM instead of recognizing a fee. Since the hedge fee is recognized upfront and only once, dividing the fee by the term of the loan provides a proxy for NIM-equivalent revenue boost. This is not a fair argument because the margin goes away when the loan prepays or is refinanced, but the fee income stays with the bank. Given a choice, banks would prefer the fee, but how can we fairly compare the hedge fee as a boost to the bank’s performance and use an economically correct NIM-equivalent calculation?
Commercial loans amortize, and they also prepay, and these two parameters change the value of the hedge fee substantially. For example, assume a $1mm commercial loan structured as 25 due 20, where the bank generated 2.57% of hedge fee income. If the loan did not amortize and did not prepay, the hedge fee only adds 13bps in additional NIM-equivalent per annum. On the other hand, if the loan is prepaid in year one, the bank would recognize (for economic purposes, not GAAP) the entire 2.57% fee in that year.
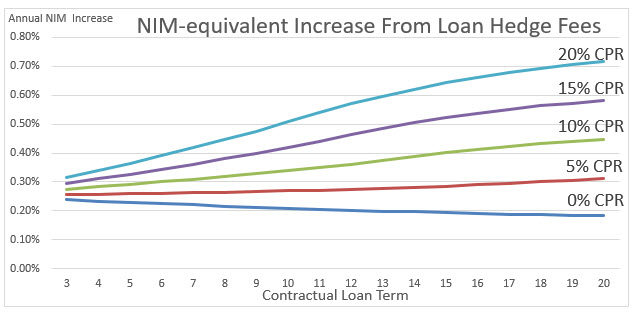
The issue is that commercial loans do amortize, and commercial borrowers do prepay loans ahead of contractual schedule for various reasons. We calculated amortizing loans (based on 25yr amortization period) for multiple terms using different prepayment assumptions measured as CPR (constant prepayment rate). As the graph below shows, when CPR increases, the value of the hedge fee increases substantially per annum. In today’s environment, CPR for community bank commercial loans is approaching 20%. Under this scenario, for 10-year hedges, community banks can expect hedge fees to add 51bps NIM-equivalent yield to their hedged loans, and for 20yr hedges, that NIM-equivalent yield increases by 71bps because of the hedge fees. The ability to generate hedge fee income in today’s lending environment can be valuable for community banks.
Conclusion
Historically hedge fees have mainly been the domain of national banks. However, community banks are also able to generate hedge fee income, and the amount of these fees can make a marked impact on community banks’ performance. As loan prepayment speeds increase, the benefit of hedge fees multiplies, generating much higher returns for the lender. Community banks should be looking for every opportunity to generate fee income, and hedge fees on commercial loans (more information on our ARC Program HERE) make sense in many instances, especially in today’s environment.