Use These Tactics When We Have A Full Inverted Yield Curve

A yield curve is a relationship between yield and different maturity dates. The yield curve’s slope can provide insight into future interest rate changes and economic activity. There is much discussion in the market about the current inverted yield curve between the two and ten-year Treasury yields. However, for bankers, the critical dates on the yield curve are short-term rates (Fed Funds) and the ten-year rate. The average bank’s cost of funding is highly correlated to Fed Funds (for the industry, the correlation has been 94% with a 6-month lag over the last 20 years), and borrowers continue to favor ten-year financing for commercial debt. Therefore, it is essential for bankers to know the shape of the yield curve between short-term and ten years. This article will consider the forecasted yield curve (Fed Funds vs. ten-year financing) for the next few years and show a tactic of how community banks can take advantage of this shape.
Forecasting Errors
First, we are not big proponents of using forecasts of economists, analysts, or salespeople. Every person that earns a living making projections has some personal stake in trying to persuade the audience of their view. If a prognosticator did not want to persuade you of their view, you would never hear from them. Instead, we favor looking at the market’s projections based on the futures market, where participants risk billions of dollars to take positions. We also look at historical performances and apply current market dynamics to project possible outcomes.
Second, banks cannot be adequately managed by positioning for one forecast. Instead, the analysis must attribute probabilities for various outcomes, and bank managers must optimize their bank’s strategy to address all materially possible outcomes given different probability weightings.
We believe there is currently a 70% probability of an inverted yield curve between Fed Funds and ten-year yield for the next two to three years. Community banks should be positioning their balance sheets and creating products to address the challenges that such an inverted yield curve will pose to the industry’s business model.
Historical Lessons
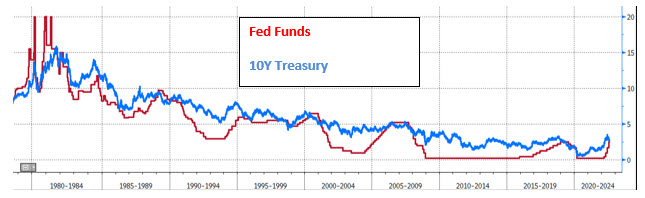
The graph below shows Fed Funds and ten-year Treasury yields from 1978. The ten-year yield is above Fed Funds for the vast majority of the time, and the two lines typically cross during recessions when the ten-year yield falls because of recession fears. Over this period, the ten-year yield is, on average, 1.18% higher than the Fed Funds rate.
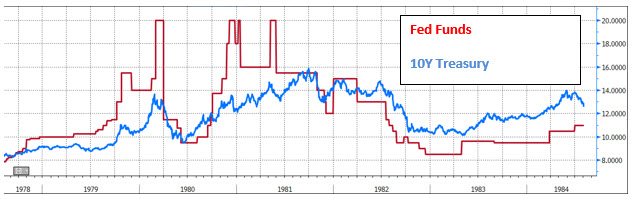
However, the period from 1978 to 1982 is unusual, as shown in the graph below. During this period, the Paul Volcker Fed was fighting inflation, and Fed Funds were above ten-year yields for much of the time from September 1978 to April 1982. During this period, we had an inverted yield curve so that the Fed Fund yield was 1.51% higher than the ten-year yield.
The current stated strategy of the Fed is to keep short-term rates high until inflation reaches its mandated level of 2%. The current TIPs market does not see headline inflation getting to 2% in the next five years (projected five-year inflation is projected to drop to 2.30% in five years).
We believe that this current inflationary environment is different from the 1970s. Still, the current Fed will do everything possible to avoid the previous mistakes of the Volcker Fed. It will keep short-term interest rates high until they achieve a noticeable and persistent inflation downturn – which may take years.
Projected Yield Curve
The graph below shows the yield curve (USD SOFR) from one month to ten years today (spot) and projected for two to 29 months. After two months (with the expected Fed Funds hike in September), the market expects an inverted yield curve. This inversion is projected to remain for the next 29 months and only slightly positively sloped for a year afterward.
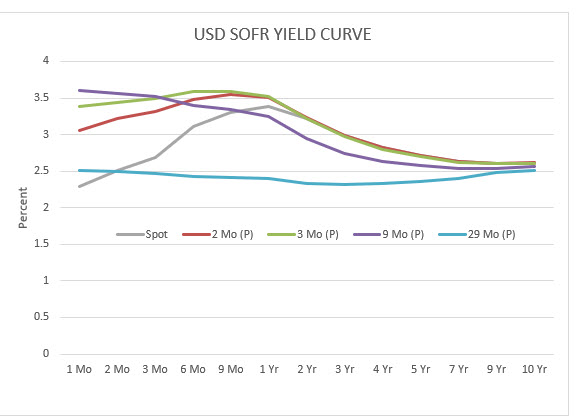
The market expects the Fed to be fighting inflation for years and to keep Fed Funds above the ten-year yield. This poses some challenges and creates some opportunities for community banks.
Action Items for Community Banks To Handle An Inverted Yield Curve
On deposits, banks need to be careful how they raise funds and reprice their current deposit base. In an environment with a flat yield curve where rates are rising, banks need to focus on their cost of funds and their deposit rate sensitivity. This makes Treasury management, goal-oriented accounts, health savings accounts, and similar longer-duration products more valuable. Community banks should allocate more sales time and marketing expenses to expand balances in these products. It would be a mistake to train bank customers to be more interest rate sensitive and extend the duration out too far for your liabilities.
On commercial loans, as short-term interest rates rise, bankers need to consider which existing floating rate loans will refinance into fixed-rate structures. Bankers also need to address credit risks from floating rate structures. For those borrowers that do not take the opportunity to fix their loan rates, bankers need to consider the DSC ratios when interest payments increase. Further, as short-term interest rates rise, borrowers on fixed-rate structures may take the opportunity to refinance their loans to lock in longer-term on their facilities. This may put banks under additional pressure to extend the duration of their loan portfolio as COF is also increasing. Unless properly managed, loan repayment speeds may increase in a rising rate environment.
Most importantly, community banks must create a proactive (not just defensive) ten-year commercial lending product. A product that is both profitable for the bank and appealing to a large segment of the bank’s prospect base. If the rate on a ten-year fixed-rate loan is 100 bps lower than a floating rate alternative, a vast majority of borrowers will opt for the certainty of a fixed rate.